


R. Jayaraman
SP Jain Institute of Management and Research
Operations Strategy (OS) gained a new perspective after the introduction of the Malcolm Baldrige Model for Business Excellence (MBM), in 1987. Many companies adopted the MBM framework, along with BalancedScoreCards(BSC)andtheAnnualQualityImprovementPlans(AQUIP)methodology,toachieve world class performance through the creation of ‘integrated organisations’ using Quality Operations Strategy (QOS) as a key driver. With the advent of Industry 4.0 (I 4.0), the possibility of creating a truly integrated organisation appears to have gained momentum. Quality Operations Strategy 4.0 (QOS 4.0) is expected to drive Business Excellence (BE) in digitalised companies in the near future, by creating integratedorganisationsusingMBMandI4.0techniques.ThispapertracestheevolutionoftheQOS,and its possible evolution in the era of I 4.0.
Keywords: Quality Operations Strategy (QOS), Business Excellence (BE), Malcolm Baldrige Model for Business Excellence (MBM), Industry 4.0, QOS 4.0, integrated organisation
INTRODUCTION
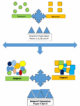
Figure 1 summarises the developments that have taken place in the Industrial Age. From craft, to mass (mass production) , to digitalised production and supply of goods and services, the world has traversed an industrial path which has changed the way people live. Even today, depending on the degree of adoption of the Industrial Way of Life, a country or a state finds itself either integrated into, or isolated from, the rest of the world. The two worlds – the developed and the developing – are primarily distinguished by the amount of industrial output. In most modern-day societies, with the exception of China and India, amongst the major economies, agriculture has taken a back seat. Two sectors of Industry – manufacturing and services – dominate the GDP, (see figure 2), to the almost complete exclusion of agriculture as a source of wealth creation.
FIGURE 1 DEVELOPMENTS IN THE INDUSTRIAL AGE

FIGURE2
THE SECTORAL SHARE IN WORLD GDP–MANUFACTURING, SERVICES, AND AGRICULTURE

(Source: https://external-preview.redd.it/t0UUMCOyGdT_oCxCVcF_EPurrhM21HzbIqekA70cB84.png?auto=webp &s=c29594930aac52d5cf154ad313c59c909ecc897f)
In the balance of the paper, I will not include any discussion on the agriculture sector, and deal primarily with the manufacturing sector only, with periodic references to the services sector, as relevant.
EVOLUTION OF OPERATIONS STRATEGY (OS) AND ITS EMBEDMENT IN THE MBM
The years of the first and second industrial revolutions (figure 1) were characterised by operations management (OM). Due to the prevalence of a seller’s market during these years, Operations Strategy (OS) was not a priority. In view of the large demand and short supply, it was enough if the producers made products and services available in the market place. The sales would be driven by the demand – supply gap, and not necessarily by other parameters, typified by the four P’s (McCarthy, 1964) or the seven P’s (Fisk et al., 1993), of the marketing mix.
As more and more products entered their terminal life cycle stages, these were speedily replaced by new products, typically with better functionality and features. The product life cycle mix ensured demand addressal in a compensatory, mutually supporting pattern. Hence volume of production and variety were key. Liquidity was high, as more and more countries printed currency to support the growth of economies, and, customers were able to pay for their purchases, thus putting them on the early stages of the learning curve of a consumptive way of life. In a study published in 1951, Bain linked the profit after tax and industry concentration for some 1,106 manufacturing companies in the USA (Bain, 1951). The performance of manufacturing companies studied by him showed that the market context and industry concentration played a key role in determining the net profit to sales ratio of companies, in a buyers’ market, dominated by competitive forces.
Although the need for an OS was indicated when Alfred Sloan introduced the concept of product management, through the manufacture of ‘cars at each price point’, between the 1920’s and the 1930’s (Sloan, 1963), only from the third industrial revolution, did OS achieve a threshold position in the formulation of corporate or business strategy (Skinner, 1969). The changed scenario was driven primarily by a massive increase in produced goods and services, economic growth, technological advancements pushing up productivity and efficiency metrics (Hart, 1995), leading to the development of an inverse supply demand gap.
The transition from a sellers’ to a buyers’ market was preceded by key developments that took place in the period 1950 to 1980. The introduction of Total Quality Management (TQM), as described in the works of Artemis et al., (1990), Imai, (1991), Logothetis, (2000), Mohanty et al., (2002), Kondo et al., (2000), Hosotani (2005), Kano, (1993), Lee and Dale (1998), provided many new ways of serving a buyers’ market. TQM hastened the production of new products, created conditions for companies to practice the 7 P’s of marketing, to gain competitive advantage in the marketplace. Total Quality meant using every weapon in the corporate armoury to serve customers better.
Two significant events in this era, which led to OS becoming a key item in the corporate agenda were the publication of a paper and a book by David Garvin (1987 and 1988) and the declaration of the Malcolm Baldrige Model for Business Excellence (MBM), 1987 (http://www.nist.gov/Baldrige). In his seminal paper on the eight dimensions of quality, David Garvin showed a new path on how quality concepts and parameters can be used to drive the OS of a company. In fact, the eight dimensions of quality, by and of themselves, could become the key themes for devising the OS. Such an OS will be called Quality Operations Strategy (QOS).
The MBM, for the first time, created a pole position for strategy formulation and implementation in a company by making it one of the seven headings under which companies can organise their work to reach the pinnacle of ‘excellent companies’. The scheme of creating excellent companies under the MBM is shown in figure 3.
FIGURE 3
THE CONSTRUCT OF MBM

(Source: http://www.nist.gov/Baldrige)
PURPOSE OF THIS RESEARCH
From 1987, MBM influenced the formulation of OS. Using the MBM, many companies became ‘world class’. The main objective of the MBM, of creating an integrated organisation, was achieved through the use of the framework shown in figure 3. However, with the advent of the Fourth Industrial Revolution, I 4.0, things have changed. Digitalisation has brought about, and will continue to do so, revolutionary changes in achieving ‘integration’, through the use of Industrial Internet of Things (IIOT), Artificial Intelligence (AI), Machine Learning (ML), cloud computing etc. It appears as if I 4.0 will take companies closer to the cherished objective of ‘integration’ aimed for in the MBM in a much more incisive manner than hitherto. The new tools and ecosystem created by digitalisation will make companies more interconnected than ever imagined before, making consensus decision making a daily and continuous event. The gathering and processing of inputs from various functions of an enterprise will make consensus building a reality. Machines will interact through intelligence generated by processing the data collected
from everywhere, and, using AI methods, ML, and more, provide inputs for instantaneous and continual decision making, either by machines or humans or a combination thereof.
This paper, using a series of propositions, aims to answer the following research questions:
RQ1:WhatisthecurrentbestpracticeinmanufacturingandservicescompaniestoaddresstheOS requirements?
RQ2:HowcantheMBM(whichincludesandisbultuponTQM)beusedasatoolforpracticingOS, leading to the concept of QOS, and, further, to QOS 4.0?
RQ3: How can the QOS 4.0 lead to the creation of ‘integrated organisations’, the main objective of the MBM sooner than otherwise?
In finding the answers to these research questions, this paper aims to build a theoretical construct, to build a new framework, QOS 4.0, which will contextualise the process of OS formulation in a new, digital world, leading to integrated functioning of companies, in a shorter time period, as compared with anything in the past. The reasons why this will happen are proposed. The construct of the QOS 4.0, quite different from the constructs for OS available hitherto, such as, trade-offs, resource-based OS, stakeholder-based OS, and others (Prakash Singh et. al., 2014), is being attempted for the first time. A new methodology for OS – as an integrator operating on an integrand – under the umbrella of the Malcolm Baldrige Model (MBM), Balanced Score Cards (BSC) and Annual Quality Improvement Planning (AQUIP) (which is a variant of the X Matrix), is also proposed.
METHODOLOGY OF RESEARCH
The methodology used is qualitative research (DeFranzo, 2011; Silverman, 2014, Adi Bhat; Allwood, 2011), using principles of meta-analysis techniques (for example, see Eman El Shenawy et. al., 2007 and Anupama Prashar, 2018), pulling together materials from MBM, strategy and I 4.0 literature. Several propositions are used to predict the path which QOS 4.0 is likely to take. These propositions will be supported by extant literature, analysis, interpolation of MBM criteria and core values with I 4.0 core concepts.
In the next section, MBM literature and its influence on OS formulation is established. In the following section, the evolution of OS/ QOS is described. The many changes expected due to I 4.0 and the overall scenario that is likely to develop in the future are enumerated in the next section. Following this, an algebraic analogy of ‘integration’ is used to better understand the concept of an integrated organisation, created by using QOS 4.0. Finally, conclusions and further work are dealt with. Through the sections, propositions are introduced at various places, to help summarise the developments and tie them together to further the understanding of the final picture of the QOS 4.0.
RESPONSE TO RQ1: WHAT IS THE CURRENT PRACTICE IN OS?
The eleven core values and the seven categories of managing a company make up the construct of the MBM (http://www.nist.gov/Baldrige), figure 3. Using the core values, companies are expected to develop action plans and implement them, to score as close to the maximum of 1,000 points, in the evaluation to be done by a team or experienced and knowledgeable Baldrige assessors. The ideal of an ‘integrated organisation’ is sought to be achieved, so that the organisation can become ‘world class’, with favourable implications for its profitability, competitiveness and business sustainability in the long run. ‘World class’ companies are those which typically perform exceedingly well in the long run (Brown, 2008).
Of the three ‘drivers’ of corporate planning and setting the goals and directions for the organisation, viz., leadership, strategy and customer focus, (see figure 3), strategy is a key function, which unifies the planning processes. Key success factors, customer centricity, financial planning and budgeting, are all
brought together to form a holistic compendium for the company to perform in a sustainable manner. The level of integration and complexity of the strategic planning process will depend on the company, its market context, its size (Brown, 2008), and operations. The MBM framework is entirely based on managing organisations through processes. Interlinking and interfacing process flows recursively, to achieve organisational goals and objectives, is the way to create integrated organisations. MBM has built upon TQM, by including strategy as a key element to align and integrate an organisation functionally and operatively. Satish Mehra et al., (2001), showed that strategy does not figure in any prior literature on TQM. This was one reason why TQM lost out to MBM. MBM addressed this gap. The goal setting and business direction provided by strategy is one of the reasons why adoption of MBM could lead to integrated companies. MBM changed the PDCA of TQM to ADLI – Approach, Deployment, Learning and Integration – as the prime mover for adoption (Corbett and Angell, 2011).
Proposition 1
MBM built upon TQM by introducing the eleven core values for performance excellence, and introduced the concept of strategy as an instrument of integration through organisational isomorphism.
Proposition 2
The MBM, a normative framework, fulfilled the need for making the endogenous PDCA activities undertaken under the TQM umbrella goal directed, well-resourced and systematically implemented by including ‘strategy’ as one of the three drivers.
The ADLI approach enabled MBM adopting companies to continuously fine tune interfaces and eliminate gaps through improved alignment. Superior alignment led to synergy, thereby integration. The integration is also predicated by the MBM framework design, (figure 3), which promotes knowledge management, benchmarking, best practices adoption and a constant results orientation across the spectrum of company activities, which, when they all come together, create the integration. (Brown, 2008). To illustrate, an integrated company works like the human body, which is perhaps the best example of an integrated organism.
An integrated organisation is defined as one which harmonizes plans, processes, information, resource decisions, workforce capability and capacity, actions, results, and analyses to support key organization- wide goals (Brown, 2008; Baldrige Excellence Framework, 2015 2016). The MBM promotes the creation of integrated organisations through the ‘systems perspective’, one of the eleven core values, which means managing all the components of the organization as a unified whole to achieve ongoing success. The system’s building blocks and integrating mechanism are the core values and concepts, the seven interrelated criteria categories, and the scoring guidelines. (Baldrige Excellence Framework, 2015 2016).
Jens Dahlgard et al., 2013, examined the gaps in the creation of an integrated organisation using the MBM, and identified three reasons. One, a lack of cascading the vision and values into the organisation, two, strategy refers only to core competencies and not core values, and, three, too many criteria and sub criteria. However, with the advent of the balanced score cards, the reasons one and two get addressed, and the third has been progressively addressed by a rationalisation of the criteria, as also, a better understanding of the criteria by practicing companies, due to the efforts of consultants and writers, who have helped companies achieve a clear understanding of the criteria and sub criteria requirements (for example, Brown, 2008). Thus, MBM criteria stand the test of time on the integration aspect.
Effective process flow management will directly impinge on the output quality (Flynn, et al., 1995). The MBM framework shown in figure 3 and the Baldrige Excellence Framework, have enabled many companies across the world to become world class through the integrated workflow. In a study of 600 US based companies which used the MBM, and other quality models, Hendricks and Singhal, 1996, found that performance improves significantly. Talwar, 2011a, has reported that, in a study of 120 companies made by the British Quality Foundation in 2003, all of them performed better than others by almost 3:1. In another study, he has reported that business results get the highest importance in most BE models (Talwar, 2011b). And results are measured as per the goals set in the strategy process, and the implementation of strategy across the board. In a study by Robin Mann et al., (2011), of 74 companies in Asia, it was concluded that the drivers of adoption were primarily linked to their competitive priorities, underscoring the importance of strategy. An example of creating an integrated organisation using a BE framework is available in the studies of Pankaj Madan (2010) and Kanji (2008).
Proposition 3
Using strategy, MBM companies could align and integrate organisational activities through processes, to create integrated companies. And OS, practiced under MBM, is called as QOS (Quality Operations Strategy), which is the way world class companies are operating.
We can thus proceed to define the QOS – which is OS practiced under the MBM framework. (a more comprehensive definition of QOS is given in the next section). The MBM framework provides the basis on which the QOS will operate in manufacturing companies to create integrated organisations, and become world class through the use of the ADLI methodology, which is unique to the MBM (Baldrige Excellence Framework, 2015-2016).
RESPONSE TO RQ2: HOW CAN THE MBM (WHICH INCLUDES AND IS BULT UPON TQM) BE USED AS A TOOL FOR PRACTICING OS, LEADING TO THE CONCEPT OF QOS, AND, FURTHER, TO QOS 4.0?
Coase (1937) wrote about the individual firm, how it is to be managed by making decisions on allocation of resources, and how to use the resources to achieve the purpose of the firm. Early strategy researchers, such as, Ansoff (1967), were predominantly concerned with identifying firms’ ‘best practices’ that contribute to firm success (as reported in Hoskisson et al., 1999). Others, including Edith Penrose (1957), Ansoff (1957), Hirsch, (1976), Jensen & Meckling, (1976), Wernerfelt (1984), Fama and Jensen, (1983), Kathleen Eisenhardt, (1989), Gale and Clavans (1985) and Richter and Anna Littmann (2013), have contributed to the development of the body of knowledge in strategy and OS. Barney, 1991, has explained the way a resource-based OS can provide sustained competitive advantage, and Mahoney and Pandian, 1992, provide the details of how a resource-based approach to strategy can have links to other approaches. They have enumerated the types of resources available to an organisation, and also how they may be the limiting factors in strategy choices. Amit and Schoemaker, 1993, explain the strategic nature of resources that a firm may possess, and how they make a difference to the firm’s market position. They postulate that the ‘resource-based view of the firm’ adopted by Coase, 1937; Penrose, 1957; Wernerfelt, 1983; Barney, 1991 and others, focuses on factor market imperfections and highlights the heterogeneity of firms, their varying degrees of specialization, and the limited transferability of corporate resources. They explain the different perspectives addressed by resources and capabilities of an organisation.
While Penrose (1957) and Jensen and Meckling (1976) described the actions of a firm to serve a market, and the agency structure which functioned as a driver of individual firms, Ansoff (1957, 1965) described the strategies a firm could use to function in a multinational context, as well as dealing with diversification as a strategic way to grow. He also proposed the Ansoff matrix for strategic positioning and decision making. This was followed by Wernerfelt (1984) who proposed the resource-based view of strategy.
The emergence of strategy as a corporate activity was cemented by the papers and books written by Michael Porter (Porter, 1980, 1981, 1990 and 1991). Porter argued that companies need to keep in mind the five forces that affect the conduct of business. He emphasised that competitive advantage is built through the design and deployment of strategy. The Porter’s value chain diagram, (Porter, 1985), is a useful method for designing company strategies. According to Porter, the two basic types of competitive advantage – cost and differentiation – combined with the scope of activities for which a firm seeks to achieve them, lead to three generic strategies for achieving above average performance in an industry: cost leadership, differentiation, and focus (https://www.ifm.eng.cam.ac.uk/research/dstools/porters-generic- competitive-strategies/). In manufacturing and service industry, the cost of operations is usually between 80 and 90% of the selling price. Given below is the information for the Indian manufacturing and non- financial services industry (figures 4 and 5).
FIGURE4
PERCENTAGE OF PEX AND RM COST TO SALES INCOME ,INDIAN MANUFACTURING INDUSTRY

(Source: CMIE Data)
FIGURE5
PERCENTAGEOFOPEXANDRMCOSTTOSALES,NON-FINANCIALSERVICES, INDIAN INDUSTRY

(Source: CMIE Data)
Thus, in the context of creating an ‘integrated organisation’, OS and corporate strategy (CS) can be used interchangeably in manufacturing and service organisations, due to the very high dependence of profits on cost of operations, as shown in figures 4 and 5. Although, there are distinct aspects of CS which have to be treated separately, like, diversification, M&A, etc. Even in these cases, the due diligence examines the viability of operations. OS can be defined as ‘the total pattern of decisions which shape the long-term capabilities of operation and their contribution to overall strategy, through the ongoing reconciliation of market requirements and operation resources’ (Slack and Lewis, 2015).
Wickham Skinner introduced the concept of OS (Skinner, 1969). His thesis was that with the advent of the computer age, manufacturing had substituted the industrial engineer with the computer expert. However, both lack the domain knowledge of the trade-offs in manufacturing. Decisions on resolving these trade-offs need a knowledge of operations management, which computer engineers specifically lacked. And top management was content to leave the OS to the lower-level staff in manufacturing, who did not have the outside-in view. They were mostly inwardly oriented, which worked well till the sellers’ market dominated. With the advent of a buyers’ market, OS became a must-do, and it had to be aligned, and, in manufacturing companies, to take the lead, in driving corporate or business strategy. The paper by Skinner set the ball rolling on developments in OS.
The situation of specialists trying to dominate operations will once again repeat in the I 4.0, when data scientists will replace computer engineers. These data scientists will be even more specialised than their earlier counterparts. OS will have to be handled by operations management generalists, who will have a working knowledge of all things in I 4.0 – IIOT, AI, Cloud computing etc. Skinner proposed a process for OS formulation, (Exhibit II of his paper, op. cit.) which, even as on date, prevails, especially after the introduction of the balanced score cards methodology of Kaplan and Norton (1992, 1993, 2001, 2001a, 2001b).
Terry Hill proposed a framework (Slack and Lewis, 2015), according to which, in five steps, a company can derive its OS. Slack and Lewis have proposed the top down and bottom-up process for OS formulation (Slack and Lewis, 2015). Building on these frameworks, the current methodology for OS formulation follows the Emergent – Directed – Realised framework.
Marco Iansiti and Alain Sefrels (2013) define directed OS as guidance provided by top management for execution and emergent OS which is inferred implicitly from the actions and decisions taken by people throughout the organisation. They also term these as top down and bottom up. They use directed and directive interchangeably. At its core, they say, OS is the link between planned strategy and executed reality. Janice Edwards, (2014), has proposed a framework of intended – deliberate- realised strategies. She also mentions emergent and non-realised strategies. Emergent strategy is an unplanned strategy that arises due to certain circumstances.
I have adopted the following definition of OS: OS is the process of planning, formulating, cascading and executing a set of actions to achieve a set of goals for a defined period, usually the long term. The OS determines the level of resources needed to achieve the goals by taking decisions in areas like technology, customer satisfaction. The ‘OS Grid’ summarises the construct of the OS (figure 6).
FIGURE 6 THE OS GRID
| TheOSGrid | |||||
| Quality | |||||
| Innovation | |||||
| Speed | |||||
| Flexibility | |||||
| Cost | |||||
Capacity | Facilities | Length of Value Chain – VI, Make or buy, Strategic Sourcing | Technology, Processes, New products and Product Management | Manpower and Organisation Development | |
(Source: Author’s Research)
The objective of OS is to create a competitive position for a firm in the marketplace, by achieving the triple bottom line (TBL) goals of economic, people and environmental profits. Hart, 1995, for the first time, introduced the concept of the link between industrial strategy and natural resources. He was the first to point out that natural resources were limited and that industry should not exploit natural resources overly. The first announcement on TBL came through the Gro Brundtland commission of the UN in 1987 (https://en.wikipedia.org/wiki/Brundtland_Commission).
Figures 4 and 5 clearly show the dominance of operations activities in the two key sectors of the economy. Thus, OS becomes the key driver of the creation of integrated companies under MBM. A similar view is taken by Gagnon, 1999, who has argued that the resource-based view of operations strategy requires that OS should not only be aligned to the marketing strategy, but also independently provide strategic alternatives to an organisation. Wheelwright and Hayes, 1985, Barnes, 2001, and Hayes and Upton, 1998, also support this view. Wheelwright, 1978, has presented reasons why OS is not always aligned with the CS. Since MBM is built on and includes TQM as its foundation, quality is a fundamental. Based on the work done by Garvin, 1987, OS becomes Quality Operations Strategy or QOS, for short. QOS is defined as OS practiced under the umbrella of MBM, using Balanced score Cards (BSC) and the Annual Quality Improvement Plans (AQUIP) (a variant of the X Matrix), addressing the TBL, and long-term business sustainability through competitiveness. An idea of QOS has been mentioned by Calingo, 1996. He has cited prior literature, and traced the essential contours of a TQM based strategy. However, he has not linked it to creating an integrated organisation. The framework of QOS is shown in figure 7:
FIGURE 7
THE SCHEMATIC SHOWING THE CONSTRUCT OF QOS

(Source: Author)
Sohrab et. al., 2013, have proposed a framework for a quality-based OS. However, their framework is not dynamic, nor is it linked with the MBM, thereby not subject to PDCA or ADLI. My model, as proposed in figure 7, is comprehensive and under the MBM. The continual improvement orientation is implicit. No other QOS or similar models are available in literature. In fact, in a review paper on OS published in 2001 by Sameer Prasad et. al., there is no mention of a QOS. This is for the first time that a QOS is being proposed which will be capable of achieving an ‘integrated organisation’. Another study, done by Prakash Singh et. al., 2014, examined OS literature and concluded that only two models of OS have been explored, viz., the trade-off model and the cumulative capabilities model. Both these do not involve either TQM or MBM, the essential features of operations in companies since 1990. It is somewhat surprising that, Prakash Singh et. al., 2014, go on to examine a further six more models of OS, but none of them is anywhere close to QOS.
The emergent strategy is the QOS emanating from the resources already available in the organisation, subjected to the ADLI. The directed strategy is the process of analysing the inputs from customers and other external stakeholders to the firm, ascertaining the current capabilities from the emergent strategy and setting goals and targets and making decisions to achieve the long-term goals set. The realised strategy is the one which the external stakeholders perceive and receive, the output which comes from the confluence of emergent and directed strategies, and which provides the competitive advantage in the marketplace, as well as advances the TBL compliance. The realised strategy is often controlled and guided by top management. The upward spirals in the figure 6 indicate the dynamic nature of the QOS due to the ADLI, and several Evaluation and Improvement (E&I) cycles will have to be gone through before an organisation becomes an
integrated whole and achieves long term business sustainability. Business sustainability is achieved when the TBL is achieved in the long run. Clement, 2005, citing the work done by Edward Freeman on the stakeholder theory of strategy, provides evidence of how addressing the needs of societal and environmental stakeholders can improve economic profit of firms and vice versa.
In terms of the MBM, figure 3, workforce and operations represent the emergent strategy; the leadership, strategy are the guiding top management collaborative; the customer (which includes all external stakeholders) represents the directed strategy; the information and knowledge management foundation represent the ADLI facilitator; and, results represent the realised strategy.
Proposition 4
The Emergent – Directed – Realised framework of QOS fits well into the format of the MBM, and, is thus suitable for developing integrated companies, when practised under the MBM umbrella, along with BSC and AQUIP.
We can now proceed to define QOS comprehensively. QOS is the practice of OS under the MBM framework, by using BSC and AQUIP. The use of BSC and AQUIP are tools which facilitate the design and implementation of the QOS. Without these, the QOS is not complete. How the use of BSC and AQUIP enable the practice of MB to create world class companies is explained in the works by Muthuraman and Jayaraman, 2014 and Jayaraman, 2020.
Proposition 5
In manufacturing and service organisations, since the cost structure is largely skewed towards operations, as shown in figure 4, the QOS will be the key and main component of the ‘strategy’, in the MBM terminology. QOS will be the key driver for integration.
What Skinner proposed in 1969, of creating an ‘integrative mechanism’, has been made possible through MBM. The integration achieved through the framework shown in figure 3 has, so far, been possible through IT, knowledge management, ADLI and the rigorous implementation of E&I cycles. With the advent of I 4.0, this integration will be hugely facilitated. The I 4.0 framework will use IT and computers in a far more rigorous way, increase automation, provide wireless connectivity over long distances, gather data at unimaginably high speeds, process these in cloud computer banks at high speeds, and, using AI, ML, algorithms and pre-programmed decision-making software, run all operations in a company in an ‘interconnected’ mode, the likes of which have never been imagined before. In the next two sections, we examine the I 4.0 and its effects on organisations in some depth, and then propose the QOS 4.0, to make the new organisations highly sustainable.
INDUSTRY 4.0 AND THE RESPONSE TO RQ3: HOW CAN THE QOS 4.0 LEAD TO THE CREATION OF ‘INTEGRATED ORGANISATIONS’, THE MAIN OBJECTIVE OF THE MBM, SOONER THAN OTHERWISE?
I 4.0 is the term used to describe the state of operations in an organisation which is manufacturing goods and services using some or all of IIOT, Big Data Analytics, AI, ML, Cloud Computing, algorithm driven pre-programmed software embedded devices like sensors which control the working of machines and production lines. The primary difference between Industry 3.0 and 4.0 is the speed of data gathering and processing, the interconnectivity between work centres, the use of ML and AI to develop algorithms for developing pre-programmed software using the data gathered and putting them through Big Data Analytics, and, principally, creating a well- connected organisation which can use data and inputs from all over the organisation, irrespective of functional silos, for analysis and decision making. Transparency, collaborative working, analytical approach, intense connectivity, continuous and constant churn of data and processing outputs will characterise I 4.0 organisations, which are significant improvements over Industry 3.0. The consolidated picture of an I 4.0 organisation for the operations value chain is shown in figure 8.
FIGURE 8
SHOWING THE BASIC BUILDING BLOCKS OF AN ORGANISATION UNDER I4.0

(Source: Author) (BD = Big Data)
The figure covers only the operations value chain part of an organisation, as defined by Porter (1981). However, I 4.0 will connect all the value chain contributors in an organisation, such as, marketing, finance, HR and so on. In other words, the full value chain shown in the Porter’s value chain diagram will be covered. This is shown in figure 9. This is the ‘fully interconnected organisation’ model under I 4.0. No doubt, most organisations will take a long time to get to this scenario. However, the ideal is what is achievable in the long run.
Figure 9 also includes the IOT, IOS, IOD and IOP (Internet of things, of services, of data and of people) which are the new tools available for integration. The QOS 4.0 is OS practiced in I 4.0 companies, under the umbrella of MBM, using balanced score cards for QOS formulation and cascading across the organisation using the AQUIP (Annual Quality Improvement Plans) methodology (For a description of the AQUIP methodology, please see Muthuraman et al., 2014).
FIGURE 9
THE TOTALLY INTERCONNECTED WORLD OF 4.0

UNDERSTANDING INTEGRATED ORGANISATIONS THROUGH AN ANALOGY
In order to show that the QOS4.0 can lead to integrated organisations, we usethe algebraic concept of the term ‘integration’. The integration of a function f(x) is the accumulation of all the pieces of f(x).dx between set limits. This is denoted by ∫𝑓(𝑥).𝑑𝑥𝑏𝑎. In the case of an organisation, the equation can be represented as:

where D1, D2…. Dn are the departments in the Porter value chain of the company. f(x) represents the totality of the processes within a department Dx, which receives inputs, processes them and converts them to outputs to meet the requirements of the next department in the internal value chain.
The integration consists of two parts – the integrator and the integrand. Integrator is the set of activities that creates a change in the integrand that it acts upon. In the case of a company, the integrand is the departments, and the integrator is the set of tools which provide the inputs, do the conversion activities and send the output to the next department in the chain. Successful integration will depend on the number of elements populating the integrator, the number of elements constituting the integrand and the felicity with which the integrator operates on the integrand to produce outcomes from the whole organisation. For example, in a company manufacturing fruit juices, the quality, variety and tastes of the juices output and sold in the market which lead to sustainable business in the long term will be the best outcome. For this, the company must attend to the inputs, such as, to be procured from environmentally friendly sources, convert the pulp into juice using wasteless methods, dispose of the wastes in a responsible way, package the juices in recyclable packs, and so on. Apart from these, the company must decide on whether it should run a responsive or an efficient supply chain, produce at acceptable costs, which will yield adequate margins to keep the business on-going.
In order to examine the ‘integrator’ and the ‘integrand’ more closely, we trace the evolution of these two aspects based on the evolution of the OS. Table 1 depicts the evolution of the ‘completeness’ of an integrated organisation, as defined in MBM.
TABLE 1
CHRONOLOGY OF EVOLUTION OF QOS 4.0
Chronology | Evolutioninelements of OS (elements shown in each phase are in addition to those shown in the previous phases) | Prevalent,dominant theories | RelevantOSliterature (Selected) |
| Phase I- till 1930 | RM Purchase, Manufacture, R&D | Transaction Cost Economics | None available |
| Phase II – 1930 – 1950 | Specifications driven quality, new products development | Agency theory | Coase, 1937 |
| Phase III – 1950 – 1990 | TQM, TPS, Takt Time, vendor/ supplier integration | Structure-conduct- performance, Porter’s theory of competitive advantage, industry as the primary unit of strategy, Transactional cost analysis, nexus of contracts, structure-conduct- performance paradigm, Ansoff matrix, originofOS, Resource Based View | Bain (1951, 1954), Ansoff, 1957; Penrose, 1959; Skinner, 1969; Jensen & Meckling, 1976; Hirsch, 1976; Porter (1980, 1985, 1996), Fama and Jensen, 1983; Wernerfelt, 1984; Eisenhardt, 1989; Gale and Clavans 1985, Wheelwright & Hayes, 1985 |
| Phase IV – 1990 – 2000 | MBM, SCM, Products Portfolio Matrix for product mix decisions, IT driven, KM, balanced score cards, AQUIP methodology | QOS: Multi divisional structure of business, Vertical Integration, strategic alliances | DiMaggio and Powell, 1983; Barney, 1991; Mahoney and Pandian, 1992; Amit and Shoemaker, 1993; Hart ,1995; Calingo, 1996; Hayes and Upton, 1998; Gagnon, 1999; Clement, 2005 |
Chronology | Evolutioninelements of OS (elements shown in each phase are in addition to thoseshowninthe previous phases) | Prevalent,dominant theories | RelevantOSliterature (Selected) |
| Phase V – 2000 – till date | Agile, Integrated Organisation, efficient and responsive supply chains | QOS: Emergent – Directed – Realised strategies | Barnes, 2001; Sameer Prasad et. al., 2001; Sohrab Khalili Shavarini et. Al., 2013; Prakash Singh et. al., 2014 |
| Phase VI – 2019 + | I 4.0, digital organisations | QOS 4.0 (yet to be fully defined,thispaperisan attempt) | Ghobakhloo, et al.,2018; Sony and Naik, 2019 |
(Source: Author)
The ‘completeness’ refers to how close an organisation is to scoring above 600 in the MBM process. Higher the score, the greater the integration. The completeness of integration is a function of how many and how well knit the integrators are, and how well they are used in the organisation to operate upon the integrand – which is the departments, functions, value chain elements (of the Porter value chain of the organisation), length of the value chain and the complexity. The completeness of the integration is visible through three elements- business sustainability achieved through the TBL accomplishments (results), the establishment of firm linkages between the various elements of the integrand by using processes (enablement) and design and implementation of processes and connectivity which enable the data acquisition, processing, analyses and decision making (quality and quantity of the integrator operating on the integrand).
Proposition 6
‘Completeness’ of integration is determined by the combined effect of three elements on the organisation: the integrator, the integrand and the process of how the integrator operates on the integrand.
Proposition 7
The ‘Completeness’ of integration is promoted by using more number of elements in the integrator which are included based on movements like TQM, MBM, lean management etc., by using more elements in the integrand which keeps expanding in size due to the addition of new elements (these elements are the departments and functions which constitute the organisation, which keep getting added over time as business conditions change) and the strength and number of ways in which the integrator operates on the integrand.
Connectedness and structuration (Dimaggio and Powell, 1983) are two aspects of organisations which improves the way in which the integrator operates on the integrand. Bureaucratisation increases the isomorphism in organisations (op. cit.), and is a powerful instrument of operation for the integrator, to spread the influence of the integrator across the organisation (similar to the concept of ‘Total’ in TQM). Dimaggio and Powell, 1983, have identified three such tools for spreading isomorphism: coercive, mimetic and normative.
New elements are added to the integrator through the development of instruments that become available to run an organisation, facilitated by the emergence of movements like TQM, lean management, MBM, I
4.0 and many other tools and techniques. The integrator typically keeps growing in size periodically, and its deployment on the integrand, to integrate and create an integrated organisation to achieve business sustainability in the long run is the main objective of MBM. The MBM framework, along with certain generic movements like balanced score cards, cascading of BSC’s into the innards of an organisation by using a world class generic tool like AQUIP, if used to create the integration, will result in truly world class organisation. (for example, see Muthuraman et al., 2014; Steve Smith, 2009 and Graetz, 2000). Table 2 traces the evolution of the integrator, the integrand and the ‘completeness of integration’ over the six phases of industrial development.
TABLE 2
THE ELEMENTS OF CREATING AN INTEGRATED ORGANISATION, THE EVOLUTION IN THE INTEGRATOR AND THE INTEGRAND
| Period | Evolutioninthe integrator | Evolutioninthe integrand | Degreeofcompletenessof integration |
| Phases I & II- Upto 1950 (sellers’ market) | Equipment, manpower, utilities (limited), internal information, some external info (e.g., market size, segmentation, customer satisfaction, etc.) | Operations value chain (OVC), with a limited front end. Low level of connectivity with finance, HR, marketing | Silos dominate, manufacturing is king, all others subservient. Low completeness. |
| Phase III – 1950 – 1990 | All above + TQM tools, Hoshin Kanri, X matrix, TPS, lean management, use of IT for MIS | Porters Value Chain, extended front and back ends (i.e., JIT with suppliers and fully connected distribution system), efficient supply chains | Silos broken to a great extent due to TQM, operations improved due to PDCA, automation, improved communications due to IT usage, close knit operations. TBL not on the horizon. Medium completeness. |
| Phase IV – 1990 – 2000 | All above + MBM, intense IT usage, automation, advent of IOT, SCADA, balanced score cards, AQUIP (creation of integrated companies begun, as indicated by the scores of companies in the MBM and many other BE awards across the world (like EFQM) | Intensified integration due to MBM, responsive supply chains, agile manufacturing, stakeholders’ interests addressed | Organisational agility, responsiveness, competitiveness, and TBL improved. MBM and other BE models help companies to create integrated companies and become world class. Some instances of well integrated companies seen in the BE awards processes. Medium to high completeness. |
| Phase V – 2000 – till date | All above + I 4.0 viz., IIOT, sensors, connectivity, cloud computing, AI, algorithms, cyber- security etc. (The number of integrated and near integrated companies across the world increases, as indicated by the MBM and other BE awards scores) | New vistas for integration found through the tools of I 4.0. The increased possibility for interconnectedness driven organisational integration is primarily because of the wide variety of new tools made operational through I 4.0 developments | Quality and quantity of output increased substantially by unlocking the potential of integrated manufacturing. Speed, quantum, scope have all been substantially increased. Possibilities to create well integrated organisations increased manifold. However, I 4.0 is in the nascent stage, and hence results will take time to become visible. |
| Period | Evolutioninthe integrator | Evolutioninthe integrand | Degreeofcompletenessof integration |
| Phase VI – 2019 + | All above + developments in AI, Machine Learning, 3 D printing, IOD, IOS, IOP, Big Data analytics | Evolving | Evolving |
(Source: Author)
Proposition 8
The creation of an integrated organisation as envisaged in the MBM can be achieved in the best possible way under the aegis of I 4.0. This can be done by using QOS 4.0, using the MBM framework, balanced score cards, AQUIP and continuously achieving ‘long term business sustainability’ through the TBL and competitiveness.
By using QOS 4.0, the speed of integration is increased considerably. This is due to the Big Data Analytics, total connectivity using a cloud-based system, algorithm driven decision making which is computer controlled. The speed is enhanced due to the speed of data processing, transparent and data driven decisions, with less manual interventions during the process. Especially, the connectivity removes the ‘silos’ present in an organisation, which is one of the biggest bottlenecks for faster decision making. Hence, it is expected that QOS 4.0 will lead to a speedier creation of an integrated organisation.
Figure 10 below summarises the main proposition, Proposition 8, of this paper, and provides the logic for the proposition.
FIGURE 10
SHOWINGTHETRANSITIONFROMPHASEITOPHASEVIOFANINTEGRATED ORGANISATION
(Source: Author)
CONCLUSIONS AND FURTHER WORK
The objective of this paper was to examine the changes that have taken place over the years in the evolution of OS as a tool for creating an integrated organisation. Till the 1950’s, OS was not considered as a distinct entity, mainly due to the prevalence of a sellers’ market. However, beyond the 50’s, markets started to shift from a sellers’ to a buyers’. This necessitated companies to devise strategies to gain a competitive position. Evolution of OS as a distinct feature of corporations owes much to the paper by Skinner (1969). Subsequent developments showed that he was prescient in his prognostication. When MBM was introduced, the status of OS in a manufacturing company, in particular, and, in any organisation, in general, was significantly upgraded to QOS. Over the years, with the MBM, companies included the BSC (or the Hoshin Kanri/ X matrix methods, the Japanese equivalent of BSC), and some variations of the AQUIP methodology, they could hope to become world class one day, as they could address the TBL requirements and a sustained competitive position. However, in spite of all the advancements, creation of a truly integrated corporation was still a virtual reality. Till I 4.0.
I 4.0 has brought in a slew of developments which will surely enable companies to become world class under the MBM – BSC – AQUIP umbrella, addressing the TBL and long-term competitiveness. This paper has provided the reasons why such a possibility exists due to the growth in the integrator and the integrand. Basically, the argument is that both the integrator and the integrand have been progressively enriched through several managerial interventions, like TQM, MBM etc., which have introduced new elements to strengthen the design and implementation of initiatives, in a series of E&I cycles, to continuously improve the ‘completeness’ of the integration. Thus, this paper has addressed the three research questions, with a number of propositions, and provided evidences from literature and case studies references.
Further work is needed to study in depth the various I 4.0 initiatives that have appeared and how they will progressively drive the integration. No doubt it will be in the positive direction, but we need to understand the nitty gritties of such improved integration.
REFERENCES
Allwood, C.M. (2011, March 2). The distinction between qualitative and quantitative research methods is problematic. Quality & Quantity. Springer Science+Business Media B.V.
Amit, R., & Schoemaker, P.J.H. (1993, January). Strategic Assets and Organizational Rent. Strategic Management Journal, 14(1), 33–46.
Anderson, J.C., Cleveland, G., & Schroeder, R.G. (1989). Operations strategy: A literature review.
JournalofOperationsManagement, 8(2), 133–153.
Ansoff, H.I. (1957). Strategies for Diversification. HarvardBusinessReview, pp. 113–124.
Ansoff, H.I. (1965, September–October). The firm of the future.HarvardBusinessReview, pp. 162–178. Ansoff, H.I., & Stewart, J.M. (1967, November–December). Strategies for a technology-based business.
HarvardBusinessReview, pp. 71–84.
Artemis, M., & Garvin, D. (1990, February 28). A Note on Quality – The views of Deming, Juran and Crosby. Harvard Business School Note Number 687-011.
Bain, J.S. (1951, August). Relation of Profit Rate to Industry Concentration: American Manufacturing, 1936-1940. The Quarterly Journal of Economics, 65(3), 293–32.
Barnes, D. (2001). Research methods for the empirical investigation of the process of formation of operations strategy.InternationalJournalofOperations&ProductionManagement, 21(8), 1076–1095.
Barney, J. (1991). Firm resources and sustained competitive advantage.JournalofManagement, 17(1), 99–120.
Bhat, A. (n.d.). Qualitativeresearch–Definition,types,methodsandexamples. Retrieved from https://www.questionpro.com/blog/qualitative-research-methods/
Brown, M.G. (2008). BaldrigeAwardWinningQuality, pp. 138–162. CRC Press, Taylor and Francis Group.
Calingo, L.M.R. (1996). The evolution of strategic quality management.InternationalJournalofQuality & Reliability Management, 13(9), 19–37.
Clement, R.W. (2005). The lessons from stakeholder theory for US business leaders. BusinessHorizons, 48, 255–264.
Coase, R.H. (1937, November). The Nature of the Firm. Economica, 4(16), 386–405.
Corbett, L.M., & Angell, L.C. (2011). Business Excellence in New Zealand: Continuous Improvement, Learning, and Change. Total Quality Management, 22(7), 755–772.
Dahlgaard, J.J., Chen, C.K., Jang, J.Y., Banegas, L.A., & Dahlgaard-Park, S.M. (2013). Business excellence models: Limitations, reflections and further development. TotalQualityManagement & Business Excellence, 24(5), 519–538.
DeFranzo, S.E. (2011). What’sthedifferencebetweenqualitativeandquantitativeresearch?
SnapSurveys. Retrieved from https://www.snapsurveys.com/blog/qualitative-vs-quantitative- research/
DiMaggio, P.J., & Powell, W.W. (1983, April). The Iron Cage Revisited: Institutional Isomorphism and Collective Rationality in Organizational Fields. AmericanSociologicalReview, 48(2), 147–160.
Edwards, J. (2014). Mastering Strategy: Art and Science. In Masteringstrategicmanagement(1st Canadian edition). Publisher BCampus.
Eisenhardt, K.M. (1989). Agency theory: An assessment and review. AcademyofManagementReview, 14(1), 57–74.
El Shenawy, E., Baker, T., & Lemak, D.J. (2007). A meta‐analysis of the effect of TQM on competitive advantage. International Journal of Quality & Reliability Management, 24(5), 442–471.
Fama, E.F., & Jensen, M.C. (1983, June). Separation of Ownership and Control. The Journal of Law & Economics, 26(2), 301–325. Corporations and Private Property: A Conference Sponsored by the Hoover Institution. The University of Chicago Press.
Fisk, R.P., Brown, W., & Bitner, M.J. (1993). Tracking the Evolution of Services Marketing Literature.
JournalofRetailing, 69(1), 61–103.
Flynn, B.B., Schroeder, R.G., & Sakakibara, S. (1995). The Impact of Quality Management Practices on Performance and Competitive Advantage. Decision Sciences, 26(5), 659–690.
Gagnon, S. (1999). Resource‐based competition and the new operations strategy. InternationalJournalof Operations & Production Management, 19(2), 125–138.
Gale, B.T., & Clavans, R. (1985). Formulating a quality improvement strategy. JournalofBusiness Strategy, 5(3), 21–32.
Garvin, D.A. (1987). Competing in the Eight Dimensions of Quality.HarvardBusinessReview, 87, 101– 109.
Garvin, D.A. (1988, February 8). ManagingQuality:Thestrategicandcompetitiveedge(1st Ed.). Free Press.
Ghobakhloo, M. (2018). The future of manufacturing industry: A strategic roadmap toward I 4.0.Journal of Manufacturing Technology Management, 29(6), 910–936.
Graetz, F. (2000). Strategic change leadership. ManagementDecision, 38(8), 550–564.
Hart, S.L. (1995, October). A Natural-Resource-Based View of the Firm.TheAcademyofManagement Review, 20(4), 986–1014.
Hayes, R.H., & Upton, D.M. (1998). Operations based strategy.CaliforniaManagementReview, 40(4), 7–24.
Hendricks, K.B., & Singhal, V.R. (1996). Quality awards and the market value of the firm: An empirical investigation. Management Science, 42(3), 415–436.
Hirsch, S. (1976). An International Trade and Investment Theory of the Firm. OxfordEconomicPapers, 28(2), 258–270.
Hoskisson, R.E., Hitt, M.A., Wan, W.P., & Yiu, D. (1999). Theory and research in strategic management: Swings of a pendulum. Journal of Management, 25(3), 417–456. https://doi.org/10.1177/014920639902500307
Hosotani, K. (2005). TheQCProblemSolvingApproach. India: Productivity Press (India) Private Limited.
Iansiti, M., & Sefrels, A. (2013, July). Operations Strategy Reading. In R. Shapiro (Ed.), Core CurriculuminOperationsManagement(pp. 1–37). Harvard Business School Publication.
Imai, Masaki. (1991). Kaizen:ThekeytoJapan’scompetitivesuccess. McGraw Hill International Edition.
Jayaraman, R. (2020, July). Impact of adopting a PDCA methodology on performance of companies – Experience from companies in India. Measuring Business Excellence (Pre-print version). – this paper has since been published- the correct reference is: Jayaraman, R. (2021), Impact of adopting a PDCA methodology on performance of companies – Experience from companies in India. Measuring Business Excellence, 25(2),189-215.
Jensen, M.C., & Meckling, W.H. (1976, October). Theory of the Firm: Managerial Behaviour, Agency Costs and Ownership Structure. Journal of Financial Economics, 3(4), 305–360.
Kanji, G.K. (2008). Architecture of business excellence in the public and service sector. TotalQuality Management, 19(4), 399–415.
Kano, N. (1993, Spring). Perspective on Quality Activities in American Firms. CaliforniaManagement Review, pp. 12–31.
Kaplan, R., & LaMotte, G. (2001). TheBSCandqualityprograms. HBS Publishing, Reprint Number B0103D.
Kaplan, R., & Norton, D. (1992, January-February). The balanced score card: Measures that drive performance. Harvard Business Review, pp. 71–79.
Kaplan, R., & Norton, D. (1993, September–October). Putting the BSC to work. HarvardBusiness Review, pp. 133–147.
Kaplan, R., & Norton, D. (2001a, March). Transforming the BSC from performance measurement to strategic management: Part I. Accounting Horizons, 15(1), 87–104.
Kaplan, R., & Norton, D. (2001b, June). Transforming the BSC from performance measurement to strategic management: Part II. Accounting Horizons, 15(2), 147–160.
Khalili Shavarini, S., Salimian, H., Nazemi, J., & Alborzi, M. (2013). Operations strategy and business strategy alignment model (Case of Iranian industries). International Journal of Operations & Production Management, 33(9), 1108–1130.
Kondo, Y., & Kano, N. (2000). Quality in Japan. Section 41. In Juran’sQualityHandbook(5th Ed., pp.41.1–41.33).
Lee, R.G., & Dale, B.G. (1998). Policy deployment: An examination of the theory. InternationalJournal of Quality & Reliability Management, 15(5), 520–540.
Logothetis, N. (2000). Managingfortotalquality:FromDemingtoTaguchiandSPC. Prentice Hall of India Private Limited.
Madan, P. (2010). An award journey for business excellence: The case study of a public sector unit. Total Quality Management & Business Excellence, 21(12), 1343–1364.
Mahoney, J.T., & Pandian, J.R. (1992). The resource‐based view within the conversation of strategic management. Strategic Management Journal, 13(5), 363–380.
Mann, R., Adebanjo, D., Laosirihongthong, T., & Punnakitikashem, P. (2011). Awareness and impact of business excellence in Asia. Total Quality Management & Business Excellence, 22(11), 1237– 1258.
McCarthy, E.J. (1964). BasicMarketing:AManagerialApproach. Homewood, IL, USA: Richard D. Irwin, Inc.
Mehra, S., Hoffman, J.M., & Sirias, D. (2001). TQM as a management strategy for the next millennia.
International Journal of Operations & Production Management, 21(5/6), 855–876. Mohanty, R.P., & Lakhe, R.R. (2002). TQM in the service sector. Jaico Publishing House.
Muthuraman, B., & Jayaraman, R. (2014, January–March). Driving business strategy in large organisations through BSC. Vikalpa, 39(1), 1–19.
NIST. (2015–2016). BaldrigeExcellenceFramework. Retrieved from http://www.nist.gov/Baldrige
Penrose, E. (1995). The theory of the growth of the firm (3rd Ed.), pp. 88–101. Oxford University. Porter, M.E. (1980). CompetitiveStrategy:TechniquesforAnalysingIndustriesandCompetitors. New
York: Free Press.
Porter, M.E. (1981). The contributions of industrial organization to strategic management 2. Academyof Management Review, 6(4), 609–620.
Porter, M.E. (1985). Chapter 1. In Competitiveadvantage:Creatingandsustainingsuperiorperformance
(pp. 1–32). New York: The Free Press.
Porter, M.E. (1990, March–April). The competitive advantage of nations. HarvardBusinessReview, pp.
73–91.
Porter, M.E. (1991). Towards a dynamic theory of strategy. StrategicManagementJournal, 12(Special Issue), 95–117.
Prasad, S., Babbar, S., & Motwani, J. (2001). International operations strategy: Current efforts and future directions. International Journal of Operations & Production Management, 21(5/6), 645–665.
Prashar, A. (2018). TQM as business strategy: A meta-analysis review. Int.J.ProductivityandQuality Management, 23(1), 74–89.
Richter, A., & Littmann, A. (2013). Strategy and Structure. In E. Kessler (Ed.), Encyclopaediaof Management Theory (pp. 800–803). Sage.
Silverman, D. (2014). Chapter 1. In Interpretingqualitativedata. London: Sage Publications. Retrieved from https://myslide.es/documents/interpreting-qualitativa-data.html
Singh, P.J., Wiengarten, F., Nand, A.A., & Betts, T. (2014). Beyond the trade-off and cumulative capabilities models: Alternative models of operations strategy. International Journal of Production Research, 53(13), 4001–4020.
Skinner, W. (1969, May). Manufacturing – Missing link in corporate strategy. HarvardBusiness Review,
pp. 136–145.
Slack, N., & Lewis, M. (2015a). Chapter 1. In OperationsStrategy(pp. 1–34). Pearson Publishers. Slack, N., & Lewis, M. (2015b). Operations Strategy (p.252). Pearson Publishers.
Slack, N., & Lewis, M. (2015c). Operations Strategy (p.29). Pearson Publishers. Sloan, A.P. (1963, October). MyyearswithGeneralMotors. Crown Business Books.
Sony, M., & Naik, S. (2019). Key ingredients for evaluating Industry 4.0 readiness for organizations: A literature review. Benchmarking: An International Journal, 27(7), 2213–2232. https://doi.org/10.1108/bij-09-2018-0284
Steve Smith, W. (2009). Vitality in business: Executing a new strategy at Unilever. JournalofBusiness Strategy, 30(4), 31–41.
Talwar, B. (2011a). Business excellence models and the path ahead. TheTQMJournal, 23(1), 21–35.
Talwar, B. (2011b). Comparative study of framework, criteria and criterion weighting of excellence models. Measuring Business Excellence, 15(1), 49–65.
Wernerfelt, B. (1984). A Resource-Based View of the Firm. StrategicManagementJournal, 5(2), 171– 180.
Wheelwright, S.C. (1978, February). Reflecting corporate strategy in manufacturing decisions.Harvard Business Review, pp. 57–67.
Wheelwright, S.C., & Hayes, R.H. (1985, January–February). Competing through manufacturing.
HarvardBusinessReview, pp. 99–109.