


Alexis Varin, Jovanne Palvair, Lennie Messager, Jamal Bamoulid, Yacine Benchikh, Jasper Callemeyn, Mélanie Chaintreuil, Ludivine Dal Zuffo, Didier Ducloux, Imane Farhat, Mathieu Legendre, Laurent Martin, Florian Renosi, Xavier Roussel, Thibaut Vaulet, Maarten Naesens, Claire Tinel, View ORCID ProfileBaptiste Lamarthée
doi: https://doi.org/10.1101/2025.04.21.25324260
Abstract
In solid organ transplantation, monocytes and macrophages play a cross-cutting role in the rejection process, irrespective of the transplanted tissue and the type of rejection. Here, we integrated multiple single-cell assays (>150,000 cells) with a broad spectrum of blood-derived and renal allograft-derived cells. We observed 6 myeloid cell trajectories enriched in the allograft during rejection, ranging from circulating CD14+ monocytes to differentiated macrophages in the kidney, with one trajectory culminating in a pro-inflammatory macrophage expressing CXCL9 and CXCL10. By analyzing over 850 biopsies using deconvolution, we report that they are absent in pre-transplant allografts, while these CXCL10+ macrophages are the immune cells most associated with inflammation during acute rejection. Furthermore, a survival study of over 500 biopsies indicates that they increase the risk of graft loss independently of other immune cells. CXCL10+ macrophages differentiate from recipient monocytes, and we have identified 6 major genes associated with their differentiation, including LILRB2. In vitro, mimicking allogenic activation of blood monocytes via the CD47/SIRP-a axis induced overexpression of LILRB2, suggesting that CXCL10+ macrophages are activated by this pathway. Finally, we show that macrophages overexpressing LILRB2 induce the proliferation of autologous T lymphocytes. Altogether, the present study provides further insight into the pro-inflammatory axes of recipient-derived monocytes/macrophages, and suggests LILRB2 as a therapeutic target.
Introduction
In the field of solid organ transplantation, graft rejection remains one of the major challenges to ensuring the survival and optimal function of the transplanted organ. While this phenomenon is influenced by various cell types and immune mechanisms1, monocytes and macrophages play a crucial and cross-cutting role in the rejection process, regardless of the transplanted tissue or histological picture of rejection2. A recent study has notably consolidated a vast amount of transcriptomic data from multiple solid organ transplants, including kidney, heart, liver, and lungs, revealing a common feature in the rejection of these organs: myeloid cell-driven inflammation3. This study identified the myeloid-derived CXCL9 and CXCL10 chemokines as central players in this inflammatory process, highlighting a shared mechanism of rejection across different transplanted tissues4. The ability of CXCL9 and CXCL10 chemokines to be induced in pan-organ rejection, is reflected by the fact that they form excellent biomarkers of rejection5–8, as illustrated by their routine measurement in the urine of kidney transplant patients to monitor immune quiescence9. Interestingly, this research suggests that current phenotypes of rejection, against a background of T-cell targeted immunosuppression, does not longer appear to be primarily mediated by antibodies or T lymphocytes, but rather by monocytes and macrophages.
Additionally, three decades of animal model research demonstrate that monocytes are not merely passive players in the immune response but are capable of directly recognizing allogeneic tissues10. These studies have showed that monocytes, independently of the adaptive immune response, can initiate11 and sustain alloimmune rejection12. This capacity of monocytes and macrophages to act as primary drivers of histological lesions, through mechanisms outside the classic T and B cell responses13 reinforces their central role in the immune response to pan-organ transplants. These findings challenge the prevailing understanding of rejection by the adaptive immune system and emphasize the central role of myeloid cells in the inflammatory response leading to graft failure.
Monocytes and macrophages are particularly involved through their ability to infiltrate the allograft, contributing to the initiation and amplification of the immune response and the progressive degradation of the graft. However, despite their recognized importance, the precise mechanisms by which circulating monocytes, infiltrate the transplanted organ and differentiate into fully functional macrophages within the renal graft remain largely unknown.
Here, we aimed to conduct an in-depth analysis of myeloid cell populations in the context of kidney graft rejection. By leveraging single-cell sequencing technologies, we established a high-resolution cellular profile of over 150,000 cells derived from the blood of 13 patients (including 5 without rejection and 8 with rejection) and from kidney grafts of 33 patients (15 without rejection and 18 with rejection). We identified differentiation trajectories from circulating monocytes to tissue-resident macrophages and we identified key genes such as FCN1, LILRA2, LILRB2, LILRA5, LST1 and LY6E involved in the differentiation of proinflammatory macrophages driving graft rejection. Finally, we explored in vitro and in vivo the significance of these molecules in allogeneic myeloid responses.
Methods
Single-cell RNA-sequencing data analysis
Main object generation
The current study is a retrospective analysis of 46 publicly available single-cell RNASeq datasets from kidney transplanted patients, either peripheral blood mononuclear cells (PBMCs) or allograft-derived cells harvested from kidney biopsies. Raw data were downloaded either from the NCBI’s Gene Expression Omnibus database (accession number: GSE14592714, GSE17137415 and GSE14098916), from BioStudies (accession number E-MTAB-1145017 and E-MTAB-1205118) or from NCBI’s BioProject (accession number: PRJNA97456819). Count matrices were filtered using the following parameters: cells having <300 and >10,000 genes detected and circulating cells presenting >10% mitochondrial transcripts were excluded whereas biopsy-derived cells presenting >25% mitochondrial transcripts were excluded. Filtered gene expression matrices were then merged into a single object using the Seurat R package version 5.0.120, normalized with Seurat’s NormalizeData function as well as scaled and centered using Seurat’s ScaleData function. The top 2,000 most variable genes were calculated with Seurat’s FindVariableFeatures function prior to calculating principal components (PC) using Seurat’s RunPCA function. Integration was performed using rpca method in Seurat’s IntegrateLayers function20, on the supercomputer facilities of the Mésocentre de Franche-Comté. UMAP coordinates were calculated from the top 50 PC using Seurat’s RunUMAP function and visualized with Seurat’s DimPlot function. Unsupervised clustering was performed using Seurat’s FindNeighbors and FindClusters functions with a resolution of 0.47, which led to the identification of 23 distinct clusters. Cell types were annotated by comparing the most differentially expressed genes (DEG) in each cluster, calculated using Seurat’s FindAllmarkers function, with canonical markers from the litterature14–19,21–26; some highly specific DEG found in each cluster and previously unreported in the literature were also highlighted alongside canonical markers. Dot plots and cell proportion barplots were generated using respectively the DotPlot_Heatmap and Barplot_Cell_Proportion functions from the R package RightOmicsTools version 2.2.027, with normalized counts as input data.
Myeloid cells reintegration
Cells identified as monocytes, macrophages and cDC were subsetted from the main object and reintegrated in order to determine their cell subtypes composition. Briefly, the top 2,000 most variable genes were recalculated, prior to a new integration with rpca method. UMAP coordinates and unsupervised clustering were calculated using Seurat’s respective functions from the top 50 PC and a resolution of 0.85, which led to the identification of 11 distinct clusters. Annotation was performed on Seurat’s FindAllMarkers top DEG in each cluster and compared to canonical markers from the literature14–19,28,29. Seurat’s FindMarkers function was used to find DEG between SELENOP+ macrophages and CXCL10+ macrophages, and a volcano plot was built from the −log10 transformed false discovery rate (FDR) adjusted p-values and the log2 fold change values for each gene using the R package ggplot2 version 3.5.1; the significance cutoff was set to a −log10 transformed FDR adjusted p-value of 15 and a log2 fold chance below −1.5 or above 1.5.
Determination of myeloid cell origin
Two genes’ signatures were built from a set of 3 genes specific to either chromosome X (XIST, JPX and FTX, thereafter designated as “female signature”) or chromosome Y (DDX3Y, KDM5D and USP9Y, thereafter designated as “male signature”) and a module score was calculated on biopsy-derived scRNASeq samples for each signature using the R package UCell version 2.6.230. Datasets showing a sex mismatch between the donor and the recipient with a clear opposing signatures expression observed using the blend parameter of Seurat’s FeaturePlot function were selected for further analysis: TAC1, TAC2, TAC3, TAC4, BELA2, BELA3, GSM4339776, GSM4339779, EXT241, NEPH012, NEPH016, NEPH017 and NEPH019. Cell identities were obtained from the blended FeaturePlot’s ggplot2 object using ggplot2’s ggplot_build function and then matching the data (x and y coordinate values of the scatterplot) of colored cells positive for either signature with UMAP’s cell embeddings.
Cell-cell communication analysis
The R package CellChat version 2.1.231 was used to investigate ligands-receptors interactions between cell types and unravel communication networks. Annotations from reintegrated myeloid cells were transferred onto the same cells in the main object (matching cell barcode IDs from both objects) using Seurat’s SetIdent function. The CellChat database was appended to add interactions or modify existing interactions based on published data32–34. A CellChat object was created from the normalized count matrix and annotations of the main Seurat object and overexpressed genes, interactions, and communication probabilities were computed using CellChat’s respective functions identifyOverExpressedGenes, identifyOverExpressedInteractions, computeCommunProb (with TriMean type), filterCommunication (minimum 10 cells), computeCommunProbPathway, aggregateNet and netAnalysis_computeCentrality. Incoming and outgoing interaction strength were visualized using CellChat’s netAnalysis_signalingRole_scatter function. Networks of ligands-receptors pairs were generated using the cc_network function from the R package CCPlotR version 0.99.335. Two other CellChat objects were created by splitting the normalized count matrix into two matrices, based on the rejection status (no rejection vs rejection). Overexpressed genes, interactions, and communication probabilities were computed again using the same functions from CellChat, and both objects were then merged together. A word cloud representing the most overexpressed ligands in each condition was built using CellChat’s computeEnrichmentScore function.
Trajectory inference analysis
The R package slingshot version 2.10.036 was used to explore trajectories/lineages in myeloid cells. The cell embeddings matrix corresponding to UMAP coordinates of reintegrated myeloid cells was used as input for pseudotime inference using slingshot’s slingshot function, with classical monocytes as the starting cluster. Custom functions were developed for trajectories visualization on UMAP coordinates using ggplot2, the R package patchwork version 1.2.0 and slingshot’s slingPseudotime and slingCurves functions to extract inference results data for plotting.
Trajectory-based differential expression analysis
The R package tradeSeq version 1.16.037 was used to find key genes significantly associated with each trajectory identified by slingshot. The raw count matrix of reintegrated myeloid cells was filtered using the RightOmicsTools’ tradeSeqPreprocess function, keeping genes only expressed in more than 10 cells and removing mitochondrial, ribosomal and non-coding genes, in order to reduce computational burden without losing much information, poorly represented genes being unlikely to contribute; 13,981 genes passed the selection. The filtered raw counts matrix as well as the slingshot output converted into a SlingshotDataSet object were first used as input to tradeSeq’s evaluateK function, which determines the number of knots to fit on each trajectory for differential expression analysis. Upon selecting 5 knots based on evaluteK results, the same input objects were then used to fit a negative binomial generalized additive model (NB-GAM) for each gene on each trajectory using tradeSeq’s fitGAM function on the supercomputer facilities of the Mésocentre de Franche-Comté. Computation time was greatly reduced using parallel computing from BiocParallel version 1.36.0 and batchtools version 0.9.17 R packages; a custom Slurm template was created and used as input to BiocParallel’s BatchtoolsParam function to take advantage of the scheduler capacity to automatically divide calculations into individual jobs, submit them in parallel to cluster nodes, and retrieve results from within the R environment. Within lineage DEG comparison was performed using RightOmicsTools’ tradeSeqTests function, which is a wrapper around tradeSeq’s earlyDETest adding FDR adjusted p-value and tidying the data, between knot 3 and 4 with fitGAM results as input. A rank score was built from the results of each of these statistical tests, corresponding to (Wald statistic rank)2 + (mean or median log2 fold change rank)² (as computed by the R base rank function, with ties randomly broken) for each gene on each lineage or within lineage comparison, and plotted alongside the log10 transformed Wald statistic values and log10 transformed mean or median log2 fold change values for each gene using a custom ggplot2 code. Genes corresponding to the 90th percentile and up in terms of rank score (as computed by the R package stats’s quantile function, with 0.9 probability) from each lineage or within lineage comparison were selected and visualized on Venn diagrams, produced using the R package venn version 1.12. Knots on trajectories were visualized on UMAP coordinates using tradeSeq’s plotGeneCount function and a custom ggplot2 code. Scatterplots, smoothed gene expression curves and pseudotime heatmaps were generated respectively by the RightOmicsTools’ curveSmoothers and heatmapSmoothers functions.
Interrogation of the PROMAD atlas
The online atlas tool was used to retrieve relative expression data for FCN1, LILRA2, LILRA5, LILRB2, LST1 and LY6E in kidney biopsies from the control or acute rejection groups (https://shiny.maths.usyd.edu.au/PROMAD/). Only the 21 rejection datasets including the 6 genes of interest were considered here. After selecting the datasets on the tool, the object in RDS format was downloaded, and the expression data corresponding only to the 6 genes of interest were extracted in R. These data were then statistically compared between groups using Prism software for each of the datasets indicated using two-tailed Unpaired t test.
Determination of transcription factor activity
The R package decoupleR version 2.8.038 was used to infer the transcription factor (TF) activity between SELENOP+ macrophages and CXCL10+ macrophages. The reference database, called CollecTRI39, containing a curated collection of TFs and their transcriptional targets, was built using decoupleR’s get_collectri function. Cells corresponding to SELENOP+ macrophages and CXCL10+ macrophages were subsetted from the reintegrated myeloid cells and the normalized count matrix as well as the CollecTRI object were used as input to the decoupleR’s run_ulm function, which computes a score using a Univariate Linear Model (ULM) for each TF in each cell based on the expression level of each TF’s transcriptional targets. This score reflects therefore the activity of a transcription factor based on the expression of the genes it regulates. The ULM score results of 1318 TFs were stored as a matrix in a new assay in the macrophages’ Seurat object and scaled and centered using Seurat’s ScaleData function. The top 10 most differentially active TF in each of the two macrophage’s subtypes were determined by averaging each TF activity in each cell type, subtracting the mean SELENOP+ macrophages activity from the mean CXCL10+ macrophages activity and selecting the first 10 and the last 10 TFs. Finally, the RightOmicsTools’ Cell_Heatmap function was used to visualize in the ULM assay the activity of these TFs in each cell.
Deconvolution
The cellular composition of 1,374 publicly available kidney allograft biopsy microarray samples were inferred by the CIBERSORTx algorithm40 using the kidney allograft biopsy scRNAseq data from this work.
scRNAseq signature matrix construction and validation
Annotations from reintegrated myeloid cells identified as classical monocytes, intermediate and non-classical monocytes, as well as SELENOP+ macrophages and CXCL10+ macrophages were transferred onto the same cells in the main object (matching cell barcode IDs from both objects) using Seurat’s SetIdent function. Cells originating from kidney allograft biopsies were subsetted from the main object and the raw count matrix was normalized to Counts Per Million (CPM) with Seurat’s NormalizeData function using the Relative Counts (RC) normalization method and a scale factor of 1,000,000. The benchmarking_init function from the R package deconvBenchmarking version 0.1.041 was used to divide the normalized count matrix into a training matrix, composed of 5% of cells randomly selected from each cell type, thus maintaining the original proportions of cell types within the original matrix, and a validation matrix, created using the remaining 95% of cells, whose expression was averaged per cell type and randomly distributed into 100 simulated pseudobulk mixtures (constituting the ground truth). The random cell type composition is known and varies for each of the 100 mixtures to benchmark CIBERSORTx performance. The training and validation matrices were exported as tab-separated text files using respectively the create_cibersortx_input parameter of deconvBenchmarking’s benchmarking_init function and RightOmicsTools’ Mixture_File_Builder function, and uploaded into the web interface of CIBERSORTx. The training matrix was used as input to the “Create Signature Matrix” module of CIBERSORTx. Given that a droplet-based technique (10X Chromium) was used for generating the scRNAseq datasets, the Min. Expression value parameter was reduced to 0.25. This adjustment aims to increase the reliability of the signature matrix, as recommended by CIBERSORTx, resulting in a matrix consisting of 6172 genes and 23 cell types. The signature matrix and the validation matrix were then used as input to the “Inpute Cell Fractions” module of CIBERSORTx to estimate the cell proportions of the simulated pseudobulk mixtures, using S-mode batch correction and 100 permutations for statistical significance. A Pearson’s correlation coefficient was calculated for each cell type by comparing the estimated cellular composition from CIBERSORTx to the simulated pseudobulk mixtures’ ground truth in order to validate the signature matrix.
Cellular composition estimation of microarray data
Six publicly available microarray datasets were downloaded from the NCBI’s GEO FTP servers (accession numbers: GSE2137442, GSE3605943, GSE4858144, GSE9832045, GSE14708946 and GSE14745147) as gunzipped text files. After extraction, the text files were divided into metadata and expression matrix. For the GSE36059 and GSE48581 datasets, samples corresponding to ABMR, TCMR and Mixed were selected. For the GSE98320 dataset, the Borderline and ABMRsusp. samples were excluded. For the GSE147089 dataset, two samples with missing survival data were excluded. The probe ID of each gene was converted into its matching ENSEMBL ID using the R package oligo version 1.66.0 and the corresponding Affymetrix database. The six expression matrices were then loaded into BIOMEX software version 1.0.548 to map the ENSEMBL IDs into HGNC symbols. Finally, since the expression matrices were already log2-RMA normalized, they were not further processed and were exported and converted into tab-separated text files using the RightOmicsTools’ Mixture_File_Builder function and uploaded into the web interface of CIBERSORTx. The validated signature matrix and each expression matrix were then used as input to the “Inpute Cell Fractions” module of CIBERSORTx, using S-mode batch correction and 100 permutations for statistical significance. Various custom ggplot2 codes were employed to visualize the cell proportions as box plots, bar plots, scatter plots and violin plots. Radar plots were generated using the radarchart function from the R package fmsb version 0.7.6.
M1 and M2 macrophages bulk RNA-sequencing data analysis
Raw data were downloaded from the NCBI’s GEO database (accession number: GSE14602849) and loaded into BIOMEX software version 1.0.548. Metadata corresponding to macrophages M1 and M2 subtypes were added, counts were normalized. A volcano plot of M1 vs M2 comparison was generated, DEG results used to build the plot (log2 fold change, p-value and FDR adjusted p-value) were exported into R and the volcano plot was reconstructed from these values using ggplot2; the significance cutoff was set to a −log10 transformed FDR adjusted p-value of 2 and a log2 fold chance below −1.5 or above 1.5. Genes found to be significant on the volcano plot between SELENOP+ and CXCL10+ macrophages were represented and four quadrans were drawn depending on significance cutoff, with a fifth area representing no significance.
Isolation of PBMC by density gradient
Peripheral blood from Buffy coats (Etablissement Français du Sang-BFC, France) was filtered through a 70µm strainer. Two volumes of blood were poured onto one volume of Lymphocyte separation medium (Eurobio Scientific, Les Ulis, France). Cells were then centrifuged for 30 min at 800g at room temperature. PBMC were washed with Phosphate-Buffered Saline (PBS, Thermofisher, Courtaboeuf, France) by centrifugation at 450g at 4°C for 5min. The cell pellet was resuspended in PBS, then centrifuged at 2100g for 2min at 4°C to remove the platelets.
Flow cytometry analysis
Samples to be analyzed by flow cytometry were centrifuged at 700g 5min at room temperature. One million cells from each condition were labeled with fluorochrome-coupled antibody for 15min at 4°C. Prior to cytometric analysis, labeled cells were washed with 2mL PBS and centrifuged at 700g 5min at room temperature before being resuspended in 200 µL PBS for analysis on a DxFlex cytometer (Beckman Coulter, Paris, France) or an Attune cytometer (Thermofisher). The following antibodies were used: anti-LILRB2 PE-Vio 770 (REA184, Miltenyi Biotec), anti-CD16 BV605 (3G8, Biolegend). When indicated, incubation with Fixable Viability Stain 700 (BD Biosciences, Paris, France) was performed prior to incubation with the coupled antibodies according to the supplier’s recommendations.
Monocyte sorting
Monocytes were magnetically sorted from PBMC either by the CD14 Microbeads kit for transduction experiments or by the PanMonocyte kit (Miltenyi Biotec, Paris, France) for in vitro activation experiments following the supplier’s recommendations. A minimum purity of over 85% was required to start the experiments.
Monocyte activation
Anti-CD47 (PA5-80435, Thermofisher) and a non-specific control antibody (10500C, Thermofisher) were coated in a 12-well plate (3413, Corning) for 4h at 37°C at a concentration of 3µg/mL in PBS. The wells were then emptied and 0.5.106 purified monocytes suspended in 1mL of warm RPMI supplemented with 10% FBS and 1% Pen/Strep medium were deposited in each well before spinoculation for 1min at 100g, followed by incubation at 37°C with 5% CO2.
Lentiviral transduction
To induce expression of the LILRB2 in THP-1, we used lentiviral strategy (VectorBuilder, Neu-Isenburg, Germany) with a lentivirus encoding LILRB2 and a reporter gene encoding TagGFP2. THP-1 were transduced at a multiplicity of infection (MOI) of 2.5 in the presence of 8 mg/L Polybrene (PL001, VectorBuilder). Briefly, 0.5.106 cells per well were seeded in P24 well plate in the presence of virus particles and Polybrene. Control wells contained only 0.5.106 cells/well and culture medium. The transduction was performed by spinoculation, i.e. centrifugation at 32°C, 1000 g for 90 minutes before culture for 2 days. To induce expression of the LILRB2 in human primary macrophages, monocytes freshly isolated from healthy volunteers were subjected to M0 differentiation by M-CSF (130-096-492, Miltenyi Biotec) at 25ng/mL in X-Vivo medium (BEBP02-054Q, Lonza, Colmar, France) supplemented with 10% of FBS (10271-106, Gibco) for 2 days before transduction with virus-like particles packaging Vpx to overcome virus restriction50. The production of Vpx particles was performed as previously described51. At day 4 of culture, the cells were transduced with the lentivirus encoding LILRB2 and TagBFP2 at MOI 1. At day 10 of culture, the fully differentiated macrophages were collected for cytometry analysis and LILRB2-HLA interactions assay.
FACS isolation of THP-1 clones
Cell sorting of transduced THP-1s was performed using a BDFACS ARIA III sorter (BD Biosciences, Paris, France) at the ImaFlow Platform (Dijon, France). THP-1 cells were labelled with an anti-LILRB2 PE Vio 770. The clones expressing different levels of the reporter gene TagBFP2 were selected and sorted in a 96-well plate pre-filled with culture medium to obtain one single clone per well. Identification of each clone according to the expression levels of LILRB2 was performed on FlowJo software using the Index Sort plugin (BD Biosciences).
LILRB2-HLA interaction assay
In order to assess LILRB2-HLA interaction, cells of interest were incubated with HLA-B27-APC pentamer (F294-4B-E, ProImmune, Oxford, UK) or HLA-A2-A2-PE pentamer (F10-2B-E, ProImmune) according to the supplier’s recommendations.
ORLY-EST ancillary cohort
ORLY-Est (Orientation of the Lymphocyte Response to the Occurrence of Atherosclerotic Complications After Kidney Transplantation, NCT02843867) is a prospective cohort study of kidney transplant patients included in seven French transplant centers (Besançon, Clermont-Ferrand, Dijon, Le Kremlin-Bicêtre, Nancy, Reims and Strasbourg), whose main objective was to understand the interactions between immune status and post-transplant outcomes. For each patient, blood samples were collected on the day of transplantation (d0) and one year later (d365). Peripheral blood mononuclear cells (PBMC) were separated by density gradient centrifugation (Pancoll, Pan-Biotech GmBH Aidenbach, Germany) and stored in liquid nitrogen at the Centre de Ressources Biologiques Ferdinand Cabanne (Dijon, France). Samples were collected with the regulatory approval of the French Ministry of Health (agreement number DC-2008-713 dated June 11, 2009), and the study was approved by the ethics committee of the Université de Franche-Comté in 2008. All patients included in the ORLY-Est study were of legal age at the time of transplantation, and gave written informed consent. For this ancillary present study, PBMC were stained for flow cytometry analysis as previously described in an 8-batch sequence including a common healthy PBMC for batch normalization. To ensure analysis quality, cytometry files were normalized between batches using the CytoNorm52 plugin, and abnormal events intrinsic to cytometry were removed using the FlowClean53 plugin.
Inflammation level analysis
A diagnostic label was awarded to each biopsy based on the presence and severity of these histological lesions and on the DSA status. In this aim, all biopsies were categorized into one of six recently described clinicopathological categories54, based on the presence of acute histological lesions and recipient DSA status (available at https://rejectionclass.eu.pythonanywhere.com/). This data-driven classification allows for visualization of the biopsies on a two-dimensional polar plot in which the theta angle associates with the spatial localization of the inflammation, i.e., microvascular inflammation versus tubulointerstitial inflammation. The radius indicates the global severity of the inflammatory infiltrate given by the sum of re-weighted acute lesions scores, scaled to the unit interval (from 0 to 1) and is hereafter designated as “Activity index”54,55.
Autologous T Cell Proliferation Assays
On the day of monocyte sorting, the remaining PBMC from the same donors were cultured in complete RPMI supplemented with IL-2. To achieve coculture with syngeneic macrophages, PBMCs were stained with Cell Trace Red according to the manufacturer’s procedure (Cell Trace, Thermofisher). Labeled cells were cultured with human CD3/CD28 T activator beads (Dynabeads, Thermofisher) in a 96-well UBottom plate in 100µL of complete RPMI at 1,106 cells/mL with or without 100µL of macrophages. For dose-dependent experiments, the number of labeled PBMC was fixed, while the number of macrophages varied from a ratio of 1:1 to 1:4 (macrophages:PBMC). T-cell division was detected after 5 days by flow cytometry and analyzed using the Proliferation module of FlowJo software.
Statistical analysis
We report descriptive statistics using mean and standard deviation (or median and interquartile range for skewed distributions) for continuous variables or numbers, and percentages for discrete variables, for the full cohort and for the rejection subgroups. We used the most recent (as of July 2025) versions of all software programs, including R Studio (version 2025.05.0+496) and Prism (version 10; GraphPad Software, San Diego, CA, United States) for statistical analysis and data presentation. The time-dependent ROC curve analysis of survival data was performed with the function survivalROC from the R package survivalROC version 1.0.3.156 at 365 days post biopsy and using the Kaplan-Meier (KM) method. The Youden index57 was computed from the specificity and sensitivity values of the model, as defined by the formula sensitivity + specificity – 1 for each cell type and represented using a custom gpplot2 code. The Kaplan-Meier survival curves58 right-censored at 1825 days post biopsy were generated using the survfit and Surv functions from the R package survival version 3.5-759 and visualized with the ggsurvplot function from the R package survminer version 0.5.060. Cox proportional hazards analysis of survival data right-censored at 365 days post biopsy was performed using survival’s coxph function and visualized using survminer’s ggforest function.
Results
Single-cell integration of kidney allograft and blood-derived cells
To characterize the infiltration of circulating monocytes and their differentiation into macrophages in kidney transplant patients, we integrated 46 single-cell RNA-Seq datasets, including 13 datasets corresponding to blood-derived cells (including N=5 without rejection and N=8 rejections) and 33 datasets corresponding to kidney allograft-derived cells (including N=13 without rejection and N=20 rejections, Fig. 1A). The rejection phenotypes were diverse from a histological point of view and showed varying levels of inflammation, ranging from mild to severe. In addition, for N=3 patients, including two cases of rejection, we were able to integrate both blood cells and cells from the kidney allograft collected on the same day, contributing to the robustness of the results (Fig. 1B). After passing quality controls (Fig. S1a), we successfully integrated 150,876 transcriptomes without any major batch effects, whether between datasets, tissue of origin, or between the rejection group compared to the non-rejection group (Fig. S1b). In an unsupervised manner, 23 different clusters were identified, corresponding to blood and kidney cells. The annotation using canonical and unsupervised markers (Fig. 1C, Supplemental Table 1) of these clusters led to the identification of immune cells subtypes such as S100A12+ LYZ+ CD14+ monocytes and C1QA+ C1QB+ MS4A4A+ macrophages (Fig. 1D). When comparing the proportion of immune cells between the rejection and non-rejection groups within the allograft, an increase in the proportion of immune cells was observed in cases of rejection, as expected. Notably, the proportion of macrophages within the allograft increased from 1.19% in non-rejection to 3.95% in cases of rejection (Fig. 1E). A global, unsupervised comparison of the main cellular interactions between rejection and non-rejection on all integrated cells reveals that the no rejection group is mainly associated with CCL5 and LGALS9 (Fig. 1F). In contrast, the rejection group is predominantly associated with CXCL10 and CXCL9 in line with recently reported pan-organ transcriptomic data across organs, which confirms that CXCL9 and CXL10 chemokines are central in rejection process3 and underscore the ubiquitous role of myeloid cells in solid-organ transplantation4.


Fig. 1.Single-cell integration of kidney allograft and blood-derived cells.
a. Experimental Approach. 46 scRNAseq datasets from kidney transplant patients were used for this analysis (n□=□13 blood with 5 no rejection and 8 rejection, and n = 33 kidney allograft biopsies with 13 no rejection and 20 rejection). b. Polar plot of the 28 rejection samples showing tissue origin and estimated inflammation level severity. c. Clustered dot plot showing average gene expression values of canonical markers (log normalized) and expression percentage of cell types represented on the Uniform Manifold Approximation and Projection (UMAP) plot. d. UMAP plot of 150,876 cells passing QC filtering and doublets removal. The main kidney cell types are represented, including loop of Henle (LOH), podocytes, vascular smooth muscle and pericytes (vSMp), proximal tubule (PT), intercalated cells type A and B (IC_A / IC_B), three endothelial cell subsets comprising vasa recta (ECvr), glomerular (ECg) and peritubular capillaries (ECptc), myeloid cells, lymphoid cells, megakaryocytes, and proliferating cells. e. Stacked barplots representing the relative cell proportion of each cell type on the UMAP plot, split by tissue origin (blood or kidney allograft biopsies) and by outcome (no rejection or rejection). f. Word cloud obtained using the computeEnrichmentScore function of Seurat and split by outcome (no rejection or rejection).
A pro-inflammatory macrophage subpopulation expressing CXCL10 is specifically enriched during rejection
We then selected all the myeloid cells annotated previously as ‘Monocyte’, ‘Macrophage’ and ‘cDC’ (Fig. 1D) for reintegration, in order to better understand the heterogeneity of myeloid cells, both in the blood and infiltrating the allograft after kidney transplantation. We thus obtained 11 different clusters in an unsupervised manner (Fig. 2A). Among them, we identified in an unsupervised approach 6 monocyte populations and their specific markers (Supplemental Table 2), such as S100A12+ CD14+ LYZ+ classical monocytes, a MARCO+ APOBEC3A+ population of intermediate monocytes, an IFIT1+ HERC5+ MX1+ population of IFN-activated monocytes, a FCGR3A+ CDKN1C+ non-classical monocyte population, a PECAM1+ CX3CR1+ TCF7L2+ patrolling monocyte population, and a monocyte population differentiating into dendritic cells, the mo-DCs expressing AHNAK and HIST1H1E. In addition, 3 populations of dendritic cells were detected: a CLEC10A+ CD1C+ FCER1A+ conventional type 2 DC (cDC2), a CLEC9A+ XCR1+ GCSAM+ cDC1 population and a TNF+ CCL3L1+ CD83+ population named hereafter “CD83 mature DC”. Finally, 2 subtypes of macrophages were distinguished from all other myeloid cells: a SELENOP+ STAB1+ TREM2+ population and a CXCL10+ ANKRD22+ population (Fig. 2B). Concerning the proportion of the overall myeloid compartment detected within allografts, we observed a substantial increase with a doubling of the global myeloid population during rejection (Fig. 2C) in line with previous reports2,61. More specifically, the infiltration ratio of myeloid cells differed according to their subtypes. While the proportion of cDC1, cDC2, CD83+ DC, mo-DC and patrolling monocyte was not enriched in allograft, the proportion of CXCL10+ macrophages, classical, intermediate and IFN-activated monocytes and SELENOP+ macrophages was statistically increased in rejection. In particular, a 5-fold increase in the proportion of CXCL10+ macrophages was observed, indicating a major enrichment of this population within the kidney allograft during rejection (Fig. 2D). Among myeloid cells detected solely within the allograft, the proportion of CXCL10+ macrophages increased significantly in rejection (0.0% vs 6.4%, P=0.0009) compared with SELENOP+ macrophages (29.2% vs 25.4%, P=0.68) suggesting that not only infiltration but also differentiation of this population is directly associated with the allogeneic response against the graft (Fig. 2E).
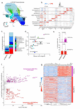
Fig. 2.A proinflammatory macrophage subpopulation expressing CXCL10 is specifically enriched during rejection.
a. UMAP plot of 37,847 cells following Seurat’s reintegration of monocytes, macrophages and cDC cell types from the main object. The main myeloid cell types are represented, including the three expected subsets of monocytes (Classical-mo, Intermediate-mo and Non-classical-mo) as well as more specific subtypes such as classical monocytes activated by interferon-gamma (IFN-activated-mo), classical monocytes in the process of differentiating into monocyte-derived dendritic cells (Mo-DC), and non-classical monocytes expressing higher levels of adhesion molecules (Patrolling-mo). Three subtypes of dendritic cells were also found, with both expected main conventional subsets (cDC1 and cDC2) and a CD14+ CD83+ cluster of monocyte-derived mature dendritic cells (CD83+ mature DC). Finally, two macrophages’ subtypes were identified, one expressing high levels of SELENOP (SELENOP+L) and another expressing high levels of several chemokines (CXCL10+L). b. Clustered dot plot showing average gene expression values of canonical markers (log normalized) and expression percentage of major cell types represented on the UMAP plot. c. Stacked barplots representing the relative cell proportion of each myeloid cell type among all kidney allograft cells, split by outcome (no rejection or rejection). d. Scatterplot representing the relative proportion ratio of each myeloid cell type among all kidney allograft cells in no rejection versus rejection samples, defining an infiltration score for each myeloid cell type during rejection. e. Barplots showing the relative proportion of SELENOP+ and CXCL10+ macrophages among all myeloid cells in no rejection versus rejection samples. Two-tailed Mann–Whitney tests comparing No rejection and Rejection samples indicate significant difference in CXCL10+ macrophages proportions but not in SELENOP+ macrophages proportions. Two-tailed Mann Whitney tests were performed to compare the groups. P-values are shown. f. Volcano plot representing DEG between SELENOP+ and CXCL10+ macrophages. g. Heatmap representing the transcription factor activity regulating the DEG between SELENOP+ and CXCL10+ macrophages.

Fig. 3.CXCL10+ macrophages are absent pre-transplantation and dramatically increase upon acute rejection
a. Experimental approach. scRNAseq-derived signature matrix was used for deconvolution of the dataset GSE147451 encompassing 192 transcriptomes from pre-transplant kidney biopsies, the dataset GSE98320 encompassing 489 transcriptomes from post-transplant biopsies with rejection phenotypes and Banff lesions scores as well as the datasets GSE48581 and GSE36059 encompassing 189 transcriptomes from post-transplant biopsies with rejection phenotypes. b. Frequency of CXCL10+ macrophages within the allograft inferred by deconvolution in GSE147451, GSE98320, GSE48581 and GSE36059 and stratified according to clinical outcome. No MOA = No Major Abnormality, IFTA = Interstitial Fibrosis and Tubular Atrophy, AMR = Antibody-Mediated Rejection, TCMR = T Cell-Mediated Rejection. The difference between groups was assessed by a two-tailed Kruskal-Wallis test and multiple comparisons using the Dunn’s test. P-values are shown. c. Pearson’s correlation coefficient and −log10 of the associated p-value, represented by a dot, with the 95% confidence interval indicated by error bars, for the correlation between the sum of Banff lesion scores related to acute rejection and the frequency of different immune cells within the allograft inferred by deconvolution in GSE98320. d. Frequency of CXCL10+ macrophages within the allograft inferred by deconvolution in GSE98320 and stratified according to Banff lesion scores of acute rejection. The difference between groups was assessed by a two-tailed Kruskal-Wallis test and multiple comparisons using the Dunn’s test. P-values are shown.
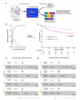
Fig. 4.CXCL10+ macrophages infiltration is associated with graft loss, independent of other immune cells
a. Experimental approach. scRNAseq-derived signature matrix was used for deconvolution of the datasets GSE147089 and GSE21374 encompassing 504 transcriptomes from post-transplant biopsies with survival metadata. b. After evaluating the diagnostic accuracy of CXCL10+ macrophages infiltration for predicting graft loss using time-dependent ROC curve analysis at one-year post biopsy, the optimal cutoff of the CXCL10+ macrophages proportion that maximizes the Youden index was calculated from the sensitivity and specificity values of the model (Jmax=0.984%). c. Kaplan Meier curves of allograft survival data right-censored at five-years post biopsy based on CXCL10+ macrophages proportion, stratified in two groups using the calculated Youden index cutoff at one-year post biopsy. The difference in survival between the two groups was assessed using the log-rank test. P-value is shown. d-e Univariate and multivariate Cox proportional hazards analysis of allograft survival data right-censored at one-year post biopsy, with the proportion of the four cell types most-associated with the activity index inflammation within the allograft as predictors, stratified in two groups using their respective calculated Youden index cutoffs at one-year post biopsy. P-values are shown.
CXCL10+ and SELENOP+ macrophages harbor distinct transcriptomic programs
By comparing the transcriptomic profiles of the two macrophage populations (CXCL10+ and SELENOP+), we observed that CXCL10+ macrophages also overexpressed 112 signature genes, including proinflammatory genes such as WARS, CXCL9, GBP1, GBP2 and GBP5 which have previously been described as major biopsy-derived transcripts associated with rejection62 (Fig. 2F). It is noteworthy that among these signature genes of CXCL10+ macrophages, a third is included in the Banff Human Organ Transplant (B-HOT) probe set panel63 including pertinent genes related to rejection and innate and adaptive immune responses (N=36/112, Supplemental Table 3). Moreover, they specifically express genes encoding LILR receptors, some of which, such as LILRB1 and LILRB2, can bind HLA molecules64. We then identified the transcription factors (TFs) potentially involved in DEG regulation in both sub-populations. In particular, SELENOP+ macrophages express TFs from the NR1H family of nuclear receptors, namely NR1H4 (FXR), NR1H3 (LXRα) and NR1H2 (LXRβ), which regulate lipid homeostasis65. In turn, CXCL10+ macrophages strongly express TFs of the Interferon Regulatory Factors (IRFs) family, notably IRF3, which induces CXCL10 expression independently of IFN-γ activation66. In a reductive manner, macrophage subtypes have historically been stratified according to pro-inflammatory M167 and pro-fibrotic M268 profiles obtained after in vitro differentiation from monocytes. We compared the transcriptomic profiles of CXCL10+ and SELENOP+ macrophages identified in vivo with M1 and M2 macrophages generated in vitro49. In CXCL10+ macrophages, 71.8% of their signature genes corresponded to genes upregulated in M1, revealing around 30% of “discordant” genes, including S100A4 and S100A6, responsible for cell mobility. As for SELENOP+ macrophages, only 32.7% of their signature genes were shared with M2, suggesting that the historical stratification between M1 and M2 derived from in vitro experiments is too limited and cannot be directly matched to macrophage subtypes described in vivo69 (Fig. S2a). We then examined the origin of the two types of macrophages using the expression of X-linked genes or Y-linked genes as previously described in patients who had received a transplant from a sex other than their own70. Unambiguously, we observed that 100% of CXCL10+ macrophages originated from the recipient, suggesting that the presence of these cells entirely relies on infiltration by circulating monocytes. SELENOP+ macrophages, on the other hand, comprise around 18% donor-derived cells and 82% recipient-derived cells, so partly tissue-resident (Fig. S2b). A comparison of the markers of these two subsets revealed that donor-derived SELENOP+ are SELENOPhi and TREM2-, while recipient-derived SELENOP+ are SELENOPlow and TREM2+ (Fig. S2c). In term of cellular interactions predicted at transcriptomic level between CXCL10+ and SELENOP+ macrophages and their microenvironment in the allograft, we detected more than 35 significantly enriched incoming signaling and more than 40 outgoing signaling (Fig. S2d). Among incoming signaling, we notably detected cell-contact CD47-SIRPA and LILRA1-B1-B2-class I HLA signaling which have been reported as responsible of allogeneic myeloid response in the animal71,72 but also PECAM1-CD38, the interaction which is required for leukocyte transendothelial migration suggesting that the CXCL10+ macrophages derive from recipient-derived monocytes. In contrast, PECAM1-CD38 interaction was not detected in SELENOP+ macrophages suggesting that this population is less susceptible to derive from monocyte infiltrating the allograft through proinflammatory chemokine gradient (Fig. S2b). In term of cytokine-receptors, CXCL10+ macrophages mainly receive TNF signaling through TNF-TNFRSF1 but also chemokines through CCL-CCR1. In return, CXCL10+ macrophages outgoing signaling is characterized by CXCL-receptors signaling and TNF signaling, suggesting both cis and trans-signaling through this pathway. Altogether these results suggest that the CXCL10+ macrophages derive exclusively from the recipient and infiltrate the allograft to induce severe inflammation.
CXCL10+ macrophages are specifically generated during the allograft response and cause acute rejection
In order to generalize our initial results to much larger external cohorts, we used the tool of deconvolution to estimate the fraction of CXCL10+ macrophages in pre- or post-transplant renal grafts. To this end, we reanalyzed datasets corresponding to N=192 preimplantation biopsies, N=489 post-transplant renal biopsies for which Banff lesions were available and N=189 post-transplant renal biopsies for which the rejection subtypes were available (Fig.3a). Strikingly, no CXCL10+ macrophages were detected in pre-transplant biopsies (median = 0.000% of total allograft cells), while a very limited contingent of these cells was measured in biopsies showing no major abnormalities (No MOA) or atrophy-fibrosis (IFTA) (median = 0.003 % and 0.000% respectively, Fig.3b). In contrast, biopsies depicting allogeneic rejection showed a significant increase of CXCL10+ macrophages with respectively a median of 0.84 % of CXCL10+ macrophages in AMR, 1.55 % in TCMR and 1.47% in mixed rejection. Conversely, in pre-implantation biopsies, the proportion of other myeloid cell types, such as SELENOP+ macrophages or cDCs, is at the same level as in No MOA, IFTA or AMR biopsies, suggesting that these cells are all detectable in the graft at the time of transplantation (Fig. S3a). These results confirm that, unlike other myeloid cells, CXCL10+ macrophages originate from the recipient and infiltrate the graft only during acute rejection and not in other contexts such as fibrosis. To clarify the association between CXCL10+ macrophage infiltration and the intensity of inflammation during rejection, we measured the rejection activity index as previously described54. We first observe considerable heterogeneity in biopsy profiles (Fig.S3b) and that, irrespective of rejection subtypes, the proportion of CXCL10+ macrophages measured in biopsies was strongly correlated with the acute rejection level given by the sum of g+ptc+i+t Banff lesions (Fig.3c) and inflammation given by the rejection activity index (Fig.S3c). We then compared the correlation between inflammation and other cell types, and found that CXCL10+ macrophages were the immune cells most positively correlated with inflammation, followed by NK, cDC and CD8 T cells (Fig.S3d). By stratifying biopsies according to Banff lesion scores characterizing rejection, the proportion of CXCL10+ macrophages gradually increase in the presence of glomerulitis, peritubular capillaritis, interstitial inflammation, intimal arteritis, tubulitis and C4d deposition (Fig.3d). Comparing to other myeloid cell types, their fold change in biopsies showing presence of acute rejection lesions was considerable (Fig.S3e). We then investigated whether CXCL10+ macrophage infiltration was associated with graft outcome. CXCL10+ macrophage levels were measured by deconvolution in 504 post-transplant biopsies (Fig.4a). At 1-year post-biopsy, the maximum Youden index (Jmax) was calculated, indicating that a proportion of 0.984% CXCL10+ macrophages discriminated between patients with significantly different graft survival (Fig.4b). Biopsies were then stratified into two groups: those in which more than 0.984% CXCL10+ macrophages were found, and those in which less than 0.984% of allograft cells were CXCL10+ macrophages. The detection in the biopsy of more than 0.984% of CXCL10+ macrophages infiltrating the allograft resulted in a significant decrease of the graft survival (Fig.4c, Log-rank P-value <0.0001). We then performed a univariate Cox regression and observed that the proportion of CXCL10+ macrophages measured in the biopsy was significantly related to the risk of subsequent graft loss (hazard ratio, 4.97; 95% CI, 2.7 to 9.15; P<0.0001). Of note, NK cells, CD8 T cells and cDC, the other cell types associated with inflammation (Fig.S3d), were also significantly associated with the risk of graft loss. Importantly, we built a multivariate Cox regression model (Fig.4d) that confirmed that patients with high CXCL10+ macrophages proportion infiltrating the allograft had a higher risk of graft loss than those with fewer CXCL10+ macrophages (hazard ratio, 2.64; 95% CI, 1.26 to 5.5; P=0.01) independently of NK cells, CD8 T cells and cDC. Overall, these results suggest that, after transplantation, pro-inflammatory CXCL10+ macrophages from the recipient infiltrate the allograft and induce microvascular and interstitial lesions, contributing to graft loss, independently of other immune cells.
Myeloid cells differentiation is driven by six main trajectories in kidney transplant recipients
In order to better characterize the origin of the CXCL10+ macrophages, we next built unsupervised pseudotime trajectories among myeloid cells. In the interests of transparency and reproducibility, our entire monocyte trajectory construction pipeline is publicly available. All of these trajectories originated from blood-derived classical monocytes and formed a branch at the level of intermediate monocytes, before being distributed in clusters of fully differentiated cells such as DCs and macrophages within the allograft, or as non-classical or patrolling monocytes which were detected in both blood and allograft (Fig. 5a). These data suggest that classical monocytes can differentiate into intermediate and then non-classical monocytes as is also the case in the event of systemic inflammation73. Surprisingly, one of the trajectories formed a loop passing through CD83 mature DC and back to classical monocytes. Moreover, the six trajectories begin to separate at the branching point annotated “3” corresponding to intermediate monocytes. We therefore wanted to investigate which transcripts were specific to segment 3-4 of the branched section corresponding to CXCL10+ macrophages. For this purpose, we compared the transcripts associated with segment 3-4 of each trajectory (Fig. 5b) considering only the most specific transcripts (Rank score>q90). We intersected the transcripts of each comparison and defined 22 transcripts which were highly associated to segment 3-4 of CXCL10+ macrophages (Fig. 5c). Among these 22 transcripts, 6 of them, FCN1, LY6E, LILRA2, LILRB2, LST1 and LILRA5 shared a similar profile and high expression (Fig. 5d). In order to confirm the increased expression of these 6 genes during rejection in external global transcriptomics datasets, we queried the PROMAD atlas3 (Fig. S4a). In 21 external datasets encompassing the 6 genes of interest and representing over 2,500 biopsies, FCN1 and LST1 expression was found to be systematically significantly increased in the graft during rejection except in two datasets. LILRA2 was significantly increased in 18/21 datasets, and LILRB2 in 15/21 datasets, confirming the importance of these transcripts during rejection. LILRA5 and LY6E, on the other hand, were only significantly increased in 7/21 datasets indicating that they may be more specific to a subtype of immune response (Fig. S4b). Plotting the expression of these genes along trajectories, we confirmed the specificity of these transcripts the CXCL10+ macrophages trajectory. Surprisingly, we also observed that LILRB2, LILRA5 together with LILRA2 transcripts were upregulated at the end of the CD83 mature DC trajectory back to classical monocytes (Fig. 5e). In mice, myeloid allorecognition is primed by CD47/SIRP-17 axis71 and leads to the overexpression of paired immunoglobulin receptors (PIRs) at myeloid cell surface72. The human orthologs of PIRs are leukocyte immunoglobulin-like receptors (LILRs). Here, our data suggest that the trajectory of CXCL10+ macrophages relies on three LILRs, LILRB2, LILRA2 and LILRA5, but also that recirculating monocytes may retain the imprint of their passage through the allograft. We therefore expanded our analysis to the other LILRs and observed that LILRA1, LILRB1 and LILRB3 also follow the same expression profiles: they are strongly increased in CXCL10+ macrophages and they are upregulated at the end of the trajectory returning to classical macrophages (Fig. S5).
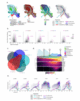
Fig. 5.Myeloid cells differentiation is driven by six main trajectories in kidney transplant recipients.
a. UMAP plots of reintegrated myeloid cells showing the 6 unsupervised trajectories obtained from slingshot and represented on cell type annotations and tissue origin, as well as pseudotime values corresponding to these trajectories and knots determined by tradeSeq and segmenting each lineage. b. Scatterplots representing early DE test between knot 3 and 4 computed statistics (Wald statistic, mean log fold change and rank score for each gene) of fitted GAM expression smoothers in 5 within-lineage comparisons (CD83+ DC trajectory versus CXCL10+L trajectory, cDC1 trajectory versus CXCL10+L trajectory, SELENOP+L trajectory versus CXCL10+L trajectory, Non-classical trajectory versus CXCL10+L trajectory and Patrolling trajectory versus CXCL10+L trajectory). c. Venn diagram showing overlapping genes among the top 90th percentile rank score in each of the 5 within-lineage comparisons of the CXCL10+ macrophages trajectory versus each other trajectory. d. Heatmap of the fitted GAM expression smoothers of 22 genes found to be significantly enriched in all 5 within-lineage comparisons of the CXCL10+ macrophages trajectory versus each other trajectory, shown alongside the pseudotime of the CXCL10+ macrophages lineage. Density of each cell type contributing to the trajectory is shown. e. Scatterplots of the log normalized expression and the corresponding fitted GAM expression smoothers curves of 6 significantly enriched genes in all 5 within-lineage comparisons of the CXCL10+ macrophages trajectory versus each other trajectory, represented alongside the pseudotime of all 6 identified lineages.
We then investigated whether this activated state due to the allogeneic responses could be captured in the blood of kidney transplant recipients. For this purpose, we built an ancillary cohort to the ORLY-EST cohort of kidney transplant recipients74. For each patient, a blood sample was collected on the day of transplantation (d0) and one year later (d365) (Fig. 6a). We therefore gathered N=64 patients with a pair of available PBMC samples (Fig. S6a). Of these patients, 8 showed mild to very severe rejection during the first year of transplantation (Fig. S6b). In order to perform a cytometric analysis limiting the potential batch effect, we followed a robust pipeline including batch correction and normalization (Fig. S6c). We then applied a gating strategy using CD14 and CD16 markers to select CD14+CD16-classical monocytes, CD14+CD16+ intermediate monocytes and CD14-CD16+ non-classical monocytes (Fig. S6d). By comparing the kinetics of LILRA1, LILRA2, LILRA5, LILRB1 LILRB2 and LILRB3 expression in these 3 populations between before transplantation and one year after, we observed that LILRA2 (GeoMFId0 = 509 vs GeoMFId365 = 626, P=0.046), LILRB1 (GeoMFId0 = 565 vs GeoMFId365 = 699, P=0.035) and LILRB2 (GeoMFId0 = 1369 vs GeoMFId365 = 1737, P=0.032) expression increases significantly in classical monocytes from patients with rejection compared with those without rejection. Moreover, this increase was not observed in intermediate or non-classical monocytes (Fig. 6b). Altogether, these results suggest that upon rejection, classical monocytes could differentiate into CXCL10+ macrophages and infiltrate the allograft or recirculate with the imprint of allogeneic activation.
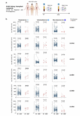
Fig. 6.LILRA2, LILRB1 and LILRB2 expression increases significantly in classical monocytes from patients with rejection.
a. Eighty-four patients were included in the ORLY EST multicenter cohort. PBMC and serum were collected at D0 and D365 post-transplant and stored at the CRB and the histocompatibility laboratory of Dijon University Hospital respectively. The proposed study is an ancillary study based on flow cytometric analysis of LILR expression in leukocytes. b. Normalized Expression of indicated markers at indicated times in indicated monocyte population. Multiple paired t tests were performed using Holm-Šídák method to compare the groups. P-values are shown.
Allogeneic activation of classical monocytes leads to increased expression of LILRB2
Recent data from allogeneic recognition models in mice suggest that allogeneic monocytes are activated via the CD47-SIRP-⍰ axis71. We hypothesized that this activation could drive the differentiation of recipient-derived monocytes into CXCL10+ macrophages. To recapitulate the impact of the allogeneic activation in circulating classical monocytes within the allograft, we thus activated them in vitro by the CD47-SIRP-⍰ axis. For this purpose, classical monocytes were isolated from the blood of healthy volunteers and an immunological synapse was artificially mimicked as is widely and historically done for T cells by activating their CD3 and CD28 receptors with antibodies coated onto the culture plastic75. Here, we used polyclonal antibodies targeting CD47, essential for myeloid allo-activation10 and measured the impact of these activations at protein levels after 48h of culture (Fig. 7a).

Fig. 7.Allogeneic activation of classical monocytes leads to increased expression of LILRB2.
a. Schematic diagram of the experiments. b. Representative overlays histograms representing the expression of annotated markers in different stimulatory conditions. c. Geometric Mean MFI of each biological replicate (N=10). Wilcoxon matched-pairs signed rank tests were used and P-values are shown.
Forty-eight hours after activation, LILRA2 was not differentially expressed at cell surface. In contrast, LILRB2 and LILRA5 were significantly increased after stimulation of CD47 (GeoMFIIg = 74975 vs GeoMFICD47 = 99030, P=0.0273 for LILRB2 and GeoMFIIg = 1439 vs GeoMFICD47 = 2338, P=0.0137 for LILRA5) compared with control condition. The expression of CD16 (GeoMFIIg = 6314 vs GeoMFICD47 = 12952, P=0. 0371) was also doubled after CD47 stimulation. Surprisingly, LILRB1 expression was significantly decreased (GeoMFIIg = 26987 vs GeoMFICD47 = 20437, P=0.0059, Fig. 5B-C). Altogether these results suggest that the allogeneic recognition of SIRP-17 via CD47 induces specifically certain LILRs such as LILRB2 and the differentiation from classical CD14+CD16-to intermediate CD14+CD16+ phenotype before macrophage differentiation.
Of note, SIRPA expression was primarily reported in myeloid cells but could also be detected in renal cells such as podocytes76–78. In addition, our cell-cell contact analysis suggested that CD47-SIRP-17 signaling in CXCL10+ macrophages relies on SIRPA expression in both SELENOP+ macrophages and PT_injured cells (Fig. S2d). We thus assessed the expression of SIRPA across all renal cell types and we confirmed that SIRPA is expressed in both podocytes and injured PT cells notably upon rejection (Fig. S7). These results suggest that CXCL10+ macrophages could continue to be activated through CD47-SIRP-17 in the tubulointerstitial compartment or in the damaged glomeruli within the allograft in addition to LILRs ligation.
Macrophages overexpressing LILRB2 bind HLA class I molecules, triggering their activation
We then wanted to explore the impact of LILRB2 overexpression in macrophages. To do this, we started with a human myeloid cell line, the THP-1 cell line79, which, according to a previous report, lost LILRB2 expression on its surface compared with primary human monocytes80. We set up a transduction strategy with lentiviral vector encoding LILRB2 and a reported gene, TagBFP2 (Fig. S8a). We then successfully isolated TagBFP2+ single cell clones by FACS and therefore generated 2 clones, D02 and G02, of THP-1 expressing high level of LILRB2 (Fig. S8b). As LILRB2 is known to bind to class HLA molecules present on the cell surface, unlike LILRA2 or LILRA5 81,82, we next assessed whether LILRB2 overexpression could lead to a modulation of binding with HLA. Historically, THP-1 were described as HLA-A2+ and HLA-B5+79. We therefore verified that THP-1 express HLA-A2 and not HLA-B27 (Fig. S8c) and we then tested the LILRB2-MHC interaction in THP-1 WT and clones D02 and G02. In THP-1 WT that do not express LILRB2, binding to self HLA (assessed by HLA-A2 pentamers) or non self HLA (HLA-B27 pentamers) is undetectable. In contrast, in LILRB2 overexpressing clones D02 and G02, we detected fixation of both self and non-self HLA (Fig. S8d).
One of the limitations of the THP-1 model is inherent in the malignant nature of this cell line. We thus assessed the capacity of LILRB2-HLA interactions in bona fide primary human macrophages. In this aim, we adapted a similar lentiviral strategy in freshly isolated monocytes (Fig. 8a). After 10 days of M0 differentiation, we measured the expression of both TagBFP2 and LILRB2 in the transduced macrophages and observed a significant increase of the percentage of LILRB2hi cells (Fig. 8b-c) compared with non-transduced control (Median percentNT = 0.00 vs Median percentLILRB2 = 53.90; P=0.0022). We applied the same LILRB2-HLA interactions assay using HLA-A2 and HLA-B27 pentamers and were able to detect class I HLA binding on LILRB2hi macrophages (Fig. 8d). We confirmed that LILRB2 overexpression on the surface of primary macrophage binds both to HLA-A2 (Median percentNT = 1.09 vs Median percentLILRB2 = 3.60; P=0.0078, Fig. 8e) and HLA-B27 (Median percentNT = 16.61 vs Median percentLILRB2 = 31.32; P=0.0273, Fig. 8f) suggesting that LILRB2 expression on the macrophages surface can be part of the immunological synapse between recipient-derived pro-inflammatory CXCL10+ macrophages and donor cells.


Fig. 8.Macrophages overexpressing LILRB2 bind HLA class I molecules, triggering their activation.
a. Schematic diagram of the lentiviral strategy used here. b. Gating strategy showing the efficacy of the approach. c. Percent of LILRB2 hi macrophages after transduction. Two-tailed Mann Whitney test was performed to compare the groups. P-values is shown. d.Gating strategy for HLA binding assays. e-f. Percentages of HLA-A2 or B-27 cells. Two-tailed Mann Whitney tests were performed to compare the groups. P-values are shown. g. Schematic diagram of CD3-CD28 activated autologous T cell proliferation assay upon co-culture with LILRB2 hi macrophages. h-i. Division index of the activated T cell post co culture with LILRB2 hi macrophages. Wilcoxon matched-pairs signed rank tests were performed to compare the NT and LILRB2hi conditions. P-values are shown.
A previous in vitro study has demonstrated that when LILRB2 is expressed on the surface of tolerogenic dendritic cells, it generates an antiproliferative signal to autologous T cells83. Here, we tested whether macrophages overexpressing LILRB2 would have an impact on the proliferation of autologous T cells (Fig. 8g). Compared with activated T cells alone, the addition of M0 macrophages to the culture slightly reduced cell proliferation, potentially through competition for nutrients (Fig. 8h). Interestingly, co-culture of LILRB2-overexpressing macrophages with T cells did not decrease T cell proliferation at a 1macro:1T cell ratio. Moreover, at a 1macro:4T cell ratio, T-cell proliferation increased significantly in the presence of macrophages overexpressing LILRB2 (P=0.0273, Fig. 6I) suggesting that LILRB2 overexpression at macrophages surface can generate a signal that positively impacts autologous T cell proliferation (Fig.9).


Fig. 9.Mechanism of activation of kidney transplant recipient-derived monocytes in the context of kidney transplantation
The upper part of the figure suggests that in a context of balanced signals provided by CD47 and SIRPa, recipient-derived monocytes transform into SELENOP+ resident macrophages. In contrast, in the presence of an imbalanced CD47/SIRPA situation, monocytes transform into inflammatory macrophages expressing LILRB2 and CXCL10 or into memory monocytes overexpressing LILRB2.
DISCUSSION
In the present study, we investigated circulating and allograft-infiltrating myeloid populations after kidney transplantation. To this end, we gathered a substantial amount of scRNAseq data from several study groups, several tissues (blood and biopsies) and several types of rejection in order to obtain a generalizable characterization of recipient monocyte/macrophage infiltration into the graft. Among the macrophage found within the allograft, we distinguished unsupervisedly two main populations, CXCL10+ macrophages and SELENOP+ macrophages. In addition to rejection-associated CXCL10+ macrophages, we identified SELENOP+ macrophages as the main macrophagic subset populating the kidney allograft. SELENOP+ macrophages show a very distinct transcriptomic profile as compare to in vitro differentiated M2 macrophages confirming that the M1-M2 classification is irrelevant in the context of allotransplantation and the description of macrophages in vivo. In line with our findings, Stewart and colleagues reported the existence of a subset of bona fide resident macrophages they annotated “MNP-d” and expressing high level of SELENOP (often also designated as SEPP1), C1QC and RNASE1 in the native kidney84. In addition, these SELENOP+ macrophages specifically express CD81, a marker for resident macrophages that is conserved in mammalian species and more specifically in mouse, rat, pig and human kidney tissue85. Intriguingly, among SELENOP+ macrophages, only recipient-derived macrophages resulting from differentiation and infiltration of circulating monocytes expressed the trigger receptor expressed on myeloid cells 2 (TREM2). TREM2 was first described in macrophage infiltrating adipose tissue86, a population derived from monocytes and named “lipid-associated macrophages, LAMs” because they share a common gene expression program enriched in lipid metabolism-related genes, including TREM2, APOE, and GPNMB87. Here, we showed that donor-derived macrophages expressed high levels of SELENOP but not TREM2 suggesting that TREM2 characterizes monocyte-derived macrophages that repopulate the kidney allograft after transplantation whereas SELENOPhi macrophages could derive from self-renewal of donor macrophages.
In contrast, CXCL10+ macrophages are uniquely derived from recipient monocytes and are major contributors of allograft inflammation during rejection independent of other immune cells. Inparticular, this population is absent in the allograft pre-transplantation and dramatically increases during rejection, expressing massive levels of the proinflammatory chemokines CXCL10 and CXCL9. Importantly, these chemokines have been confirmed in a recent large-scale transcriptomic study as essential mediators of rejection in all types of solid organ transplantation, regardless of the transplanted organ or the subtypes of rejection3. Along with chemokine transcripts, CXCL10+ macrophages also strongly express GBP1, GBP4, GBP5 and WARS, suggesting that these transcripts detected in bulk transcriptomic obtained from allograft biopsy samples and forming genes signatures of rejection62 originate primarily from this macrophage population. Importantly, WARS and GBP1 were confirmed as enriched at protein level in the allograft upon rejection88,89. CXCL10+ macrophages also specifically express ANKRD22 encoding Ankyrin repeat domain 22 (ANKRD22), a nuclear-encoded mitochondrial membrane protein that regulates mitochondrial Ca2+ and the Wnt pathway. Ankrd22-/- mice showed reduced inflammation by inhibiting macrophages tissue infiltration and TNF secretion after gastric mucosal injury90. It is noteworthy that upregulation of ANKRD22 has previously been associated with macrophages activation in patients during kidney transplant rejection91.
At ontogenic level, CXCL10+ macrophages originate from recipient-derived circulating classical monocytes. These differentiate into intermediate monocytes, then progress either to a non-classical monocyte phenotype, as reported in the context of systemic infection73, or to macrophage differentiation. Importantly, we identified 6 core genes specifically associated with the CXCL10+ macrophages differentiation: FCN1, LY6E, LST1, LILRA2, LILRB2 and LILRA5. Among these 6 genes, the expression of four of them, FCN1, LST1, LILRA2 and LILRB2, is systematically increased in biopsies showing rejection, as shown by our external validations using the PROMAD atlas.
FCN1 encodes Ficolin-1, a protein localized in the secretory granules of monocytes cytoplasm. Mechanistically, Ficolin-1 forms active proteolytic complexes with MBL-associated serine proteases, activating complement via the lectin pathway92. Importantly, C4b deposition increases with the amount of Ficolin-193. Whether CXCL10+ macrophages can induce complement activation via Ficolin-1 sensing during kidney allograft rejection, independently of the humoral response remains to be investigated.
LY6E encodes a GPI-anchored cell surface protein called Lymphocyte antigen 6 complex locus E, which is involved in cell-cell adhesion and immunological synapse94. Further investigations must be pursued to determine the role of this protein in inflammatory macrophages infiltrating the graft.
LST1 is encoded within the Major Histocompatibility Complex class III region on the short arm of chromosome 6, specifically including genes encoding components of the complement system such as C2, C4 and cytokines such as TNF95. LST1 is notably included in the B-HOT panel as one of the transcripts most implicated in solid organ rejection63. It is highly polymorphic and its rs2256965 single nucleotide polymorphism is associated with a susceptibility for nephritis in systemic lupus erythematous patients96.LILRB2, LILRA2 and LILRA5 encode LILRs which have been shown to be essential in the allorecognition process of myeloid cells64,72. Like LST1, LILRB2 is also included in the B-HOT panel 63. Interestingly, cross-linking LILRA5 on the surface of monocyte induces the mobilization of calcium, a known signaling mediator that is released during cell activation. In addition, triggering of LILRA5 on monocytes induces the secretion of interleukin-1β (IL-1β), tumor necrosis factor-α (TNF-α), and IL-6. IL-1β, TNF-α, and IL-6 are normally released in the early stages of inflammatory responses, suggesting that LILRA5 might play a role in modulating monocyte function in inflammatory settings97.
While the ligand of LILRA5 and LILRA2 is still unknown82, LILRB2 has been reported as a putative binder for HLA class I98, which was previously confirmed in vitro in transfected 293T cells and ex vivo in CD14-myelomonocytic cells99. Here we showed that after CD47/SIRP-17 activation, classical monocytes overexpress LILRB2 on their surface together with CD16, suggesting that they initiate their differentiation into intermediate-monocytes. Moreover, this increase of LILRB2 in classical monocytes was also detected in the blood of patient with rejection one year after transplantation compared to patients with no rejection. Whether this increase in LILRB2 in circulating monocyte might reflect some myeloid immune memory towards nonself HLA in patients, as suggested in mice72, remains to be validated in larger cohorts in which SIRP-17 mismatches can be monitored. Interestingly, a population of proinflammatory macrophages strongly expressing LILRB2 has been reported to infiltrate the synovium of patients with rheumatoid arthritis100. LILRB2 was historically described as inhibitory because it includes ITIMs motifs at its intracellular part but it was recently reported that PirB/LILRB2 were expressed in hepatic macrophages and bound with their NASH-associated ligand ANGPTL8 to trigger the recruitment of macrophages to the liver, providing evidence that the LILRB2/PirB-ANGPTL8 axis could be a pathogenic driver of NASH pathogenesis and fibrogenesis. Notably, an PirB/LILRB2-ANGPTL8 interaction facilitates the differentiation of hepatic macrophages to a proinflammatory phenotype by enhancing the phosphorylation of P38, AKT, and P65 signals, which in turn causes an aggravation in hepatocyte lipid accumulation and an exacerbation from simple hepatic steatosis to steatohepatitis. This report also uncovers a function of PirB/LILRB2 receptors in monocytes migration which is in line with the present study101 showing a specific increase in LILRB2 expression in recipient monocytes/macrophages infiltrating the allograft. Of note, ANGPTL8 is liver-specific and the LILRB2 ligand in kidney transplantation context remains to be characterized. Here, we showed that LILRB2 overexpression at macrophage’s surface can bind class I HLA and does not induce any antiproliferative signal to autologous T cells, suggesting that the increase of LILRB2 at CXCL10+ macrophages cell surface does not limit recipient T cells response during rejection. Instead, our results suggest that LILRB2, expressed by monocytes and then CXCL10+ macrophages, delivers an inflammatory signal to the myeloid cell in the allogeneic context. Our study does not allow us to conclude that it is the binding of LILRB2 to non-self HLA that induces this differentiation into CXCL10+ macrophages. For this, further investigations are required.
Our study has several limitations: we were unable to confirm the inflammatory monocyte/macrophage trajectories in another external dataset, but this work could be conducted in the coming years as the number of scRNASeq studies in human kidney transplantation increases every year. Spatial transcriptomics analyses would also allow us to better characterize the profile of CXCL10+ macrophages. It should be noted, that very recently, a spatial transcriptomics approach was carried out on FFPE-included renal graft biopsies, corroborating our findings. In this study, they confirm that monocytes and macrophages expressing FCGR3A are central to graft rejection, whatever the subtype of rejection. Using this new technique, they confirm that the CXCL9, CXCL10, WARS, GBP1 and GBP4 transcripts, which are CXCL10+ macrophages-specific transcripts as we described here, are universal transcripts associated with acute rejection. They also demonstrate upregulation of CD47 and SIRPA in both TCMR and AMR suggesting that this CD47/SIRP-α axis is relevant in our study in order to investigate monocyte activation during allograft rejection102.
In addition, we were unable to integrate scRNASeq data from the blood of patients with non-AMR rejection and thus cannot conclude that blood monocytes behave in exactly the same way as in AMR or stable patients with this type of rejection. Nevertheless, given that intragraft chemokine secretion measurable in urine is increased in both AMR and TCMR, this may indicate that monocyte trajectories are similar in both types of rejection. Furthermore, our in vivo flow cytometry study of LILRs expression in patient’s blood is monocentric and limited by its small size. Moreover, it includes only a single post-transplant time point and does not allow us to speculate on the modulation of monocyte LILRB2 in the longer term. Larger-scale confirmations at several post-transplant timings are needed to demonstrate increased LILRB2 expression in classical monocytes, which may reflect allogeneic activation. Finally, our in vitro analyses on the impact of LILRB2 in inflammatory macrophages remains limited by the use of differentiation by LPS and IFN-γ which, as we have shown, does not 100% reflect the profile of CXCL10+ macrophages found within the graft. Of note, several teams have proposed and developed strategies to target monocytes and macrophages as a whole, with promising and encouraging results in the context of kidney transplantation 103–105. The present study provides further insight into the pro-inflammatory axes of recipient-derived monocytes/macrophages, and suggests LILRB2 as a therapeutic target.
Data Availability
All omic data are already publicly available. All data produced in the present study are available upon reasonable request to the authors
Data sharing statement
All omic data are already publicly available. All data produced in the present study are available upon reasonable request to the authors. The complete codebase developed for the unsupervised differentiation trajectory analysis of myeloid cells is publicly available as a Jupyter Notebook at https://github.com/InsermRightLab/LILRB2-Varin-et-al/. It provides a detailed, step-by-step walkthrough of the computational workflow used to generate each figure, encompassing pseudotime inference using slingshot and identification of differentially expressed genes via tradeSeq. The primary functions, especially those integral to the computational workflow, have been consolidated into RightOmicsTools, an R package available at https://alexis-varin.github.io/RightOmicsTools/. Additional supporting code, including utility functions, is provided within the notebook repository to ensure transparency and reproducibility. Code for Seurat is available at https://satijalab.org/seurat/. Code for CellChat is available at https://github.com/jinworks/CellChat/. Code for slingshot is available at https://github.com/kstreet13/slingshot/. Code for tradeSeq is available at https://github.com/statOmics/tradeSeq/.
Acknowledgments
We thank the clinicians and surgeons, nursing staff and the patients of Dijon University Hospital. We thank Mickaël Ménager (Imagine Insitute, Paris) for providing the Vpx lentiviral vector. We thank Babacar Ndao (Inserm UMR Right, Besançon, France) for his help with fastq alignements. We thank Emilie Gaiffe, Caroline Laheurte and Eleonore Gravelin (Inserm UMR Right, Besançon, France) for their help with ORLY-EST samples. We thank Dr Christophe Masset (KU Leuven, Belgium) for providing the survival data associated with GSE147089. Figures 1a, 3a, 4a, 6a, 7a, 8a, 8g and 9 were created using Biorender.
Footnotes
- Conflict of interest The authors declare no conflict of interest regarding this manuscript.
- Funding MN is supported by the Research Foundation Flanders (F.W.O.) as senior clinical investigator (grant agreement no. 1844024N), MN is supported by a senior fundamental research project (grant agreement no. G038024N). TV and MN are supported by the Research Council of the KU Leuven (grant agreement no. C2M24057). BL is supported by the Agence Nationale de la Recherche (grant JCJC n°ANR-22-CE18-0011-01). CT is supported by the Agence de la Biomédecine (grant Recherche et Greffe 2024) and the Bourgogne Franche-Comté region (grant RECH-ANER “Initials”).
- We have added figures 4 and 5 to the manuscript and updated the texts.
References
- 1.↵Callemeyn, J. et al. Allorecognition and the spectrum of kidney transplant rejection. Kidney Int (2021) doi:10.1016/j.kint.2021.11.029.CrossRefGoogle Scholar
- 2.↵Calvani, J. et al. In situ multiplex immunofluorescence analysis of the inflammatory burden in kidney allograft rejection: A new tool to characterize the alloimmune response. American Journal of Transplantation 20, 942–953 (2020).PubMedGoogle Scholar
- 3.↵Robertson, H. et al. Decoding the hallmarks of allograft dysfunction with a comprehensive pan-organ transcriptomic atlas. Nat Med (2024) doi:10.1038/s41591-024-03030-6.CrossRefGoogle Scholar
- 4.↵Vaulet, T. & Naesens, M. Stronger together: the power of cross-organ data sets for improved allograft study outcomes. Kidney Int 106, 783–786 (2024).PubMedGoogle Scholar
- 5.↵Park, S. et al. European Society of Organ Transplantation Consensus Statement on Testing for Non-Invasive Diagnosis of Kidney Allograft Rejection. Transplant International 36, (2024).Google Scholar
- 6.Van Loon, E. et al. Automated Urinary Chemokine Assays for Noninvasive Detection of Kidney Transplant Rejection: A Prospective Cohort Study. Am J Kidney Dis 83, 467–476 (2024).PubMedGoogle Scholar
- 7.Tinel, C. et al. Development and validation of an optimized integrative model using urinary chemokines for noninvasive diagnosis of acute allograft rejection. American Journal of Transplantation 20, 3462–3476 (2020).PubMedGoogle Scholar
- 8.↵Rabant, M. et al. Urinary C-X-C motif chemokine 10 independently improves the noninvasive diagnosis of antibody-mediated kidney allograft rejection. Journal of the American Society of Nephrology 26, 2840–2851 (2015).Abstract/FREE Full TextGoogle Scholar
- 9.↵Tinel, C. et al. Transforming kidney transplant monitoring with urine CXCL9 and CXCL10: practical clinical implementation. Sci Rep 14, 20357 (2024).Google Scholar
- 10.↵Abou-Daya, K. I. & Oberbarnscheidt, M. H. Innate allorecognition in transplantation. J Heart Lung Transplant 40, 557–561 (2021).PubMedGoogle Scholar
- 11.↵Oberbarnscheidt, M. H. et al. Non-self recognition by monocytes initiates allograft rejection. Journal of Clinical Investigation 124, 3579–3589 (2014).CrossRefPubMedGoogle Scholar
- 12.↵Fox, A., Mountford, J., Braakhuis, A. & Harrison, L. C. Innate and Adaptive Immune Responses to Nonvascular Xenografts: Evidence That Macrophages Are Direct Effectors of Xenograft Rejection. The Journal of Immunology 166, 2133–2140 (2001).PubMedGoogle Scholar
- 13.↵Liu, W., Xiao, X., Demirci, G., Madsen, J. & Li, X. C. Innate NK Cells and Macrophages Recognize and Reject Allogeneic Nonself In Vivo via Different Mechanisms. The Journal of Immunology 188, 2703–2711 (2012).PubMedGoogle Scholar
- 14.↵Malone, A. F. et al. Harnessing Expressed Single Nucleotide Variation and Single Cell RNA Sequencing to Define Immune Cell Chimerism in the Rejecting Kidney Transplant. Journal of the American Society of Nephrology 31, 1977–1986 (2020).Abstract/FREE Full TextGoogle Scholar
- 15.↵Cormican, S. et al. Chronic Kidney Disease Is Characterized by Expansion of a Distinct Proinflammatory Intermediate Monocyte Subtype and by Increased Monocyte Adhesion to Endothelial Cells. Journal of the American Society of Nephrology 34, 793–808 (2023).PubMedGoogle Scholar
- 16.↵Menon, R., et al. Single cell transcriptomics identifies focal segmental glomerulosclerosis remission endothelial biomarker. JCI Insight 5, (2020).Google Scholar
- 17.↵Van Loon, E. et al. Biological pathways and comparison with biopsy signals and cellular origin of peripheral blood transcriptomic profiles during kidney allograft pathology. Kidney Int 102, 183–195 (2022).PubMedGoogle Scholar
- 18.↵Lamarthée, B. et al. Transcriptional and spatial profiling of the kidney allograft unravels a central role for FcyRIII+ innate immune cells in rejection. Nat Commun 14, (2023).Google Scholar
- 19.↵Shi, T. et al. Single-cell transcriptomic analysis of renal allograft rejection reveals insights into intragraft TCR clonality. Journal of Clinical Investigation 133, (2023).Google Scholar
- 20.↵Hao, Y. et al. Integrated analysis of multimodal single-cell data. bioRxiv 2020.10.12.335331 (2020) doi:10.1101/2020.10.12.335331.Abstract/FREE Full TextGoogle Scholar
- 21.↵Stewart, B. J. et al. Spatio-temporal immune zonation of the human kidney Europe PMC Funders Group. 365, 1461–1466 (2019).Google Scholar
- 22.Lake, B. B. et al. An atlas of healthy and injured cell states and niches in the human kidney. Nature 619, 585–594 (2023).CrossRefPubMedGoogle Scholar
- 23.Wigerblad, G. et al. Single-Cell Analysis Reveals the Range of Transcriptional States of Circulating Human Neutrophils. The Journal of Immunology 209, 772–782 (2022).PubMedGoogle Scholar
- 24.Shankland, S. J., Smeets, B., Pippin, J. W. & Moeller, M. J. The emergence of the glomerular parietal epithelial cell. Nature Reviews Nephrology vol. 10 158–173 Preprint at doi:10.1038/nrneph.2014.1 (2014).CrossRefPubMedGoogle Scholar
- 25.Tran, T. et al. In Vivo Developmental Trajectories of Human Podocyte Inform In Vitro Differentiation of Pluripotent Stem Cell-Derived Podocytes. Dev Cell 50, 102–116.e6 (2019).CrossRefPubMedGoogle Scholar
- 26.↵Schumacher, A. et al. Defining the variety of cell types in developing and adult human kidneys by single-cell RNA sequencing. npj Regenerative Medicine vol. 6 Preprint at doi:10.1038/s41536-021-00156-w (2021).CrossRefPubMedGoogle Scholar
- 27.↵Varin, A. RightOmicsTools: An R Package Providing Complementary Tools for the Manipulation and Visualization of Single Cell RNA-Seq Data. Preprint at doi:10.5281/zenodo.12518909 (2025).CrossRefGoogle Scholar
- 28.↵Thomas, G., Tacke, R., Hedrick, C. C. & Hanna, R. N. Nonclassical Patrolling Monocyte Function in the Vasculature. Arterioscler Thromb Vasc Biol 35, 1306–1316 (2015).Abstract/FREE Full TextGoogle Scholar
- 29.↵Li, Z. et al. CD83: Activation marker for antigen presenting cells and its therapeutic potential. Frontiers in Immunology vol. 10 Preprint at doi:10.3389/fimmu.2019.01312 (2019).CrossRefPubMedGoogle Scholar
- 30.↵Andreatta, M. & Carmona, S. J. UCell: Robust and scalable single-cell gene signature scoring. Comput Struct Biotechnol J 19, 3796–3798 (2021).CrossRefPubMedGoogle Scholar
- 31.↵Jin, S., Plikus, M. V & Nie, Q. CellChat for systematic analysis of cell-cell communication from single-cell and spatially resolved transcriptomics. bioRxiv 2023.11.05.565674 (2023) doi:10.1101/2023.11.05.565674.Abstract/FREE Full TextGoogle Scholar
- 32.↵van der Touw, W., Chen, H. M., Pan, P. Y. & Chen, S. H. LILRB receptor-mediated regulation of myeloid cell maturation and function. Cancer Immunology, Immunotherapy vol. 66 1079–1087 Preprint at doi:10.1007/s00262-017-2023-x (2017).CrossRefPubMedGoogle Scholar
- 33.Redondo-García, S. et al. Human leukocyte immunoglobulin-like receptors in health and disease. Frontiers in Immunology vol. 14 Preprint at doi:10.3389/fimmu.2023.1282874 (2023).CrossRefPubMedGoogle Scholar
- 34.↵Lakkis, F. G. & Li, X. C. Innate allorecognition by monocytic cells and its role in graft rejection. American Journal of Transplantation vol. 18 289–292 Preprint at doi:10.1111/ajt.14436 (2018).CrossRefPubMedGoogle Scholar
- 35.↵Ennis, S., Ó Broin, P. & Szegezdi, E. CCPlotR: an R package for the visualization of cell–cell interactions. Bioinformatics Advances 3, vbad130 (2023).Google Scholar
- 36.↵Street, K. et al. Slingshot: cell lineage and pseudotime inference for single-cell transcriptomics. BMC Genomics 19, 477 (2018).Google Scholar
- 37.↵Van den Berge, K., et al. Trajectory-based differential expression analysis for single-cell sequencing data. Nat Commun 11, (2020).Google Scholar
- 38.↵Badia-I-Mompel, P. et al. decoupleR: ensemble of computational methods to infer biological activities from omics data. Bioinformatics Advances 2, (2022).Google Scholar
- 39.↵Müller-Dott, S. et al. Expanding the coverage of regulons from high-confidence prior knowledge for accurate estimation of transcription factor activities. Nucleic Acids Res 51, 10934–10949 (2023).CrossRefPubMedGoogle Scholar
- 40.↵Newman, A. M. et al. Determining cell type abundance and expression from bulk tissues with digital cytometry. Nat Biotechnol 37, 773–782 (2019).CrossRefPubMedGoogle Scholar
- 41.↵Hu, M. & Chikina, M. Heterogeneous pseudobulk simulation enables realistic benchmarking of cell-type deconvolution methods. Genome Biol 25, (2024).Google Scholar
- 42.↵Einecke, G. et al. A molecular classifier for predicting future graft loss in late kidney transplant biopsies. Journal of Clinical Investigation 120, 1862–1872 (2010).CrossRefPubMedWeb of ScienceGoogle Scholar
- 43.↵Reeve, J. et al. Molecular diagnosis of T cell-mediated rejection in human kidney transplant biopsies. American Journal of Transplantation 13, 645–655 (2013).PubMedGoogle Scholar
- 44.↵Halloran, P. F. et al. Disappearance of T Cell-Mediated Rejection Despite Continued Antibody-Mediated Rejection in Late Kidney Transplant Recipients. Journal of the American Society of Nephrology 26, (2015).Google Scholar
- 45.↵Reeve, J. et al. Assessing rejection-related disease in kidney transplant biopsies based on archetypal analysis of molecular phenotypes. JCI Insight 2 (2017).Google Scholar
- 46.↵Callemeyn, J. et al. Transcriptional Changes in Kidney Allografts with Histology of Antibody-Mediated Rejection without Anti-HLA Donor-Specific Antibodies. Journal of the American Society of Nephrology 31, (2020).Google Scholar
- 47.↵Archer, K. J. et al. Pretransplant kidney transcriptome captures intrinsic donor organ quality and predicts 24-month outcomes. American Journal of Transplantation 22, 2515–2528 (2022).PubMedGoogle Scholar
- 48.↵Taverna, F. et al. BIOMEX: an interactive workflow for (single cell) omics data interpretation and visualization. Nucleic Acids Res 48, W385–W394 (2020).CrossRefPubMedGoogle Scholar
- 49.↵Gurvich, O. L. et al. Transcriptomics uncovers substantial variability associated with alterations in manufacturing processes of macrophage cell therapy products. Sci Rep 10, 14049 (2020).Google Scholar
- 50.↵Manel, N. et al. A cryptic sensor for HIV-1 activates antiviral innate immunity in dendritic cells. Nature 467, 214–217 (2010).CrossRefPubMedWeb of ScienceGoogle Scholar
- 51.↵Tinel, C. et al. Modulation of Monocyte Response by MicroRNA-15b/106a/374a During Antibody-mediated Rejection in Kidney Transplantation. Transplantation 107, 1089–1101 (2023).PubMedGoogle Scholar
- 52.↵Van Gassen, S., Gaudilliere, B., Angst, M. S., Saeys, Y. & Aghaeepour, N. CytoNorm: A Normalization Algorithm for Cytometry Data. Cytometry Part A 97, 268–278 (2020).CrossRefGoogle Scholar
- 53.↵Fletez-Brant, K., Špidlen, J., Brinkman, R. R., Roederer, M. & Chattopadhyay, P. K. flowClean: Automated identification and removal of fluorescence anomalies in flow cytometry data. Cytometry Part A 89, 461–471 (2016).CrossRefGoogle Scholar
- 54.↵Vaulet, T. et al. Data-driven Derivation and Validation of Novel Phenotypes for Acute Kidney Transplant Rejection using Semi-supervised Clustering. Journal of the American Society of Nephrology 32, 1084–1096 (2021).Abstract/FREE Full TextGoogle Scholar
- 55.↵Naesens, M., Cornell, L. D., Seshan, S. V. & Haas, M. Toward Activity and Chronicity Indices for the Evaluation of Kidney Transplant Rejection: A Viewpoint by the Banff Working Group. Transplantation (2025) doi:10.1097/TP.0000000000005336.CrossRefGoogle Scholar
- 56.↵Heagerty, P. J., Lumley, T. & Pepe2, M. S. Time-Dependent ROC Curves for Censored Survival Data and a Diagnostic Marker. (2000).Google Scholar
- 57.↵Youden, W. J. Index for rating diagnostic tests. Cancer 3, 32–35 (1950).CrossRefPubMedWeb of ScienceGoogle Scholar
- 58.↵Kaplan, E. L. & Meier, P. Nonparametric Estimation from Incomplete Observations. Source: Journal of the American Statistical Association vol. 53 (1958).Google Scholar
- 59.↵Therneau, T. M. & Grambsch, P. M. Modeling Survival Data: Extending the Cox Model. (2000).Google Scholar
- 60.↵Kassambara, A., Kosinski, M. & Biecek, P. survminer: Drawing Survival Curves using ‘ggplot2’. Preprint at https://rpkgs.datanovia.com/survminer/index.html (2024).Google Scholar
- 61.↵Bräsen, J. H. et al. Macrophage density in early surveillance biopsies predicts future renal transplant function. Kidney Int 92, 479–489 (2017).CrossRefPubMedGoogle Scholar
- 62.↵Halloran, P. F. et al. Review: The transcripts associated with organ allograft rejection. American Journal of Transplantation vol. 18 785–795 Preprint at doi:10.1111/ajt.14600 (2018).CrossRefPubMedGoogle Scholar
- 63.↵Mengel, M. et al. Banff 2019 Meeting Report: Molecular diagnostics in solid organ transplantation– Consensus for the Banff Human Organ Transplant (B-HOT) gene panel and open source multicenter validation. American Journal of Transplantation 20, 2305–2317 (2020).PubMedGoogle Scholar
- 64.↵Palvair, J. et al. The Potential Role of the Leucocyte Immunoglobulin-Like Receptors in Kidney Transplant Rejection: A Mini Review. Transplant International 37, (2024).Google Scholar
- 65.↵Edwards, P. A., Kast, H. R. & Anisfeld, A. M. BAREing it all: the adoption of LXR and FXR and their roles in lipid homeostasis. J Lipid Res 43, 2–12 (2002).Abstract/FREE Full TextGoogle Scholar
- 66.↵Jessica, B. et al. Direct, Interferon-Independent Activation of the CXCL10 Promoter by NF-κB and Interferon Regulatory Factor 3 during Hepatitis C Virus Infection. J Virol 88, 1582–1590 (2014).Abstract/FREE Full TextGoogle Scholar
- 67.↵Nathan, C. F., Murray, H. W., Wiebe, M. E. & Rubin, B. Y. Identification of interferon-gamma as the lymphokine that activates human macrophage oxidative metabolism and antimicrobial activity. J Exp Med 158, 670–689 (1983).Abstract/FREE Full TextGoogle Scholar
- 68.↵Stein, M., Keshav, S., Harris, N. & Gordon, S. Interleukin 4 potently enhances murine macrophage mannose receptor activity: a marker of alternative immunologic macrophage activation. J Exp Med 176, 287–292 (1992).Abstract/FREE Full TextGoogle Scholar
- 69.↵Pizzurro, G. A. & Miller-Jensen, K. Reframing macrophage diversity with network motifs. Trends Immunol 44, 965–970 (2023).CrossRefPubMedGoogle Scholar
- 70.↵Lamarthée, B. et al. Transcriptional and spatial profiling of the kidney allograft unravels a central role for FcyRIII+ innate immune cells in rejection. Nat Commun 14, 4359 (2023).CrossRefPubMedGoogle Scholar
- 71.↵Dai, H. et al. Donor SIRPα polymorphism modulates the innate immune response to allogeneic grafts. Sci Immunol 2 eaam6202 (2017).Abstract/FREE Full TextGoogle Scholar
- 72.↵Dai, H. et al. PIRs mediate innate myeloid cell memory to nonself MHC molecules. Science (1979) 368, 1122–1127 (2020).Abstract/FREE Full TextGoogle Scholar
- 73.↵Patel, A. A. et al. The fate and lifespan of human monocyte subsets in steady state and systemic inflammation. Journal of Experimental Medicine 214, 1913–1923 (2017).Abstract/FREE Full TextGoogle Scholar
- 74.↵Bamoulid, J. et al. Pretransplant thymic function predicts acute rejection in antithymocyte globulin– treated renal transplant recipients. Kidney Int 89, 1136–1143 (2016).PubMedGoogle Scholar
- 75.↵Riddell, S. R. & Greenberg, P. D. The use of anti-CD3 and anti-CD28 monoclonal antibodies to clone and expand human antigen-specific T cells. J Immunol Methods 128, 189–201 (1990).CrossRefPubMedWeb of ScienceGoogle Scholar
- 76.↵Kajiho, Y. et al. SIRP α interacts with nephrin at the podocyte slit diaphragm. FEBS J 279, 3010– 3021 (2012).CrossRefPubMedGoogle Scholar
- 77.Takahashi, S. et al. SIRPα signaling regulates podocyte structure and function. American Journal of Physiology-Renal Physiology 305, F861–F870 (2013).CrossRefPubMedGoogle Scholar
- 78.↵Kurihara, H., Harita, Y., Ichimura, K., Hattori, S. & Sakai, T. SIRP-α-CD47 system functions as an intercellular signal in the renal glomerulus. American Journal of Physiology-Renal Physiology 299, F517–F527 (2010).CrossRefPubMedWeb of ScienceGoogle Scholar
- 79.↵Tsuchiya, S. et al. Establishment and characterization of a human acute monocytic leukemia cell line (THPL1). Int J Cancer 26, 171–176 (1980).CrossRefPubMedWeb of ScienceGoogle Scholar
- 80.↵Lu, H. K. et al. Leukocyte Ig-like receptor B4 (LILRB4) is a potent inhibitor of FcgammaRI-mediated monocyte activation via dephosphorylation of multiple kinases. J Biol Chem 284, 34839– 48 (2009).Abstract/FREE Full TextGoogle Scholar
- 81.↵Redondo-García, S. et al. Human leukocyte immunoglobulin-like receptors in health and disease. Front Immunol 14, (2023).Google Scholar
- 82.↵van der Touw, W., Chen, H.-M., Pan, P.-Y. & Chen, S.-H. LILRB receptor-mediated regulation of myeloid cell maturation and function. Cancer Immunology, Immunotherapy 66, 1079–1087 (2017).CrossRefPubMedGoogle Scholar
- 83.↵Beinhauer, B. G. et al. Interleukin 10 regulates cell surface and soluble LIRL2 (CD85d) expression on dendritic cells resulting in T cell hyporesponsiveness in vitro. Eur J Immunol 34, 74–80 (2004).CrossRefPubMedWeb of ScienceGoogle Scholar
- 84.↵Stewart, B. J. et al. Spatiotemporal immune zonation of the human kidney. Science (1979) 365, 1461–1466 (2019).Abstract/FREE Full TextGoogle Scholar
- 85.↵Zimmerman, K. A. et al. Single-Cell RNA Sequencing Identifies Candidate Renal Resident Macrophage Gene Expression Signatures across Species. Journal of the American Society of Nephrology 30, 767–781 (2019).Abstract/FREE Full TextGoogle Scholar
- 86.↵Jaitin, D. A. et al. Lipid-Associated Macrophages Control Metabolic Homeostasis in a Trem2-Dependent Manner. Cell 178, 686–698.e14 (2019).CrossRefPubMedGoogle Scholar
- 87.↵Behmoaras, J., Mulder, K., Ginhoux, F. & Petretto, E. The spatial and temporal activation of macrophages during fibrosis. Nat Rev Immunol (2025) doi:10.1038/s41577-025-01186-x.CrossRefGoogle Scholar
- 88.↵Chauveau, B. et al. WARS1, TYMP and GBP1 display a distinctive microcirculation pattern by immunohistochemistry during antibody-mediated rejection in kidney transplantation. Sci Rep 12, (2022).Google Scholar
- 89.↵Chauveau, B. et al. The Proteome of Antibody-Mediated Rejection: From Glomerulitis to Transplant Glomerulopathy. Biomedicines 10, 569 (2022).Google Scholar
- 90.↵Liu, J. et al. ANKRD22 Drives Rapid Proliferation of Lgr5+ Cells and Acts as a Promising Therapeutic Target in Gastric Mucosal Injury. Cell Mol Gastroenterol Hepatol 12, 1433–1455 (2021).PubMedGoogle Scholar
- 91.↵Venner, J. M. et al. Molecular Landscape of T Cell–Mediated Rejection in Human Kidney Transplants: Prominence of CTLA4 and PD Ligands. American Journal of Transplantation 14, 2565–2576 (2014).PubMedGoogle Scholar
- 92.↵Garred, P., Honoré, C., Ma, Y. J., Munthe-Fog, L. & Hummelshøj, T. MBL2, FCN1, FCN2 and FCN3—The genes behind the initiation of the lectin pathway of complement. Mol Immunol 46, 2737–2744 (2009).CrossRefPubMedWeb of ScienceGoogle Scholar
- 93.↵Liu, Y. et al. Human M-Ficolin Is a Secretory Protein That Activates the Lectin Complement Pathway. The Journal of Immunology 175, 3150–3156 (2005).PubMedGoogle Scholar
- 94.↵Classon, B. J. & Boyd, R. L. ThymicLShared AntigenL1 (TSAL1) A Lymphostromal Cell Membrane LyL6 Superfamily Molecule with a Putative Role in Cellular Adhesion. J Immunol Res 6, 149–156 (1998).Google Scholar
- 95.↵Rollinger-Holzinger, I., et al. LST1L: A Gene with Extensive Alternative Splicing and Immunomodulatory Function. The Journal of Immunology 164, 3169–3176 (2000).PubMedGoogle Scholar
- 96.↵Mewar, D. et al. Haplotype-specific gene expression profiles in a telomeric major histocompatibility complex gene cluster and susceptibility to autoimmune diseases. Genes Immun 7, 625–631 (2006).CrossRefPubMedWeb of ScienceGoogle Scholar
- 97.↵Borges, L., Kubin, M. & Kuhlman, T. LIR9, an immunoglobulin-superfamily–activating receptor, is expressed as a transmembrane and as a secreted molecule. Blood 101, 1484–1486 (2003).Abstract/FREE Full TextGoogle Scholar
- 98.↵Shiroishi, M. et al. Human inhibitory receptors Ig-like transcript 2 (ILT2) and ILT4 compete with CD8 for MHC class I binding and bind preferentially to HLA-G. Proceedings of the National Academy of Sciences 100, 8856–8861 (2003).Abstract/FREE Full TextGoogle Scholar
- 99.↵Allen, R. L., Raine, T., Haude, A., Trowsdale, J. & Wilson, M. J. Cutting Edge: Leukocyte Receptor Complex-Encoded Immunomodulatory Receptors Show Differing Specificity for Alternative HLA-B27 Structures. The Journal of Immunology 167, 5543–5547 (2001).PubMedGoogle Scholar
- 100.↵Tedla, N. et al. The Co-Expression of Activating and Inhibitory Leukocyte Immunoglobulin-Like Receptors in Rheumatoid Synovium. Am J Pathol 160, 425–431 (2002).CrossRefPubMedWeb of ScienceGoogle Scholar
- 101.↵Li, D.-P. et al. LILRB2/PirB mediates macrophage recruitment in fibrogenesis of nonalcoholic steatohepatitis. Nat Commun 14, 4436 (2023).PubMedGoogle Scholar
- 102.↵Wongworawat, Y. C. et al. Spatial Transcriptomics Using Archived Formalin-Fixed Paraffin-Embedded Core Needle Biopsy Tissues Revealed Unique Transcriptomic Signatures in Kidney Transplant Rejections. bioRxiv 2025.04.08.647600 (2025) doi:10.1101/2025.04.08.647600.Abstract/FREE Full TextGoogle Scholar
- 103.↵Kitchens, W. H. et al. Macrophage depletion suppresses cardiac allograft vasculopathy in mice. Am J Transplant 7, 2675–2682 (2007).CrossRefPubMedGoogle Scholar
- 104.Jose, M. D., Ikezumi, Y., van Rooijen, N., Atkins, R. C. & Chadban, S. J. Macrophages act as effectors of tissue damage in acute renal allograft rejection. Transplantation 76, 1015–1022 (2003).CrossRefPubMedWeb of ScienceGoogle Scholar
- 105.↵Lai, C. et al. Targeting inflammatory monocytes by immune-modifying nanoparticles prevents acute kidney allograft rejection. Kidney Int 102, 1090–1102 (2022).PubMedGoogle Scholar